 Global| Nov 29 2005
U.S. Durable Goods Rebound; Aircraft Orders Soared
by:Tom Moeller
|in:Economy in Brief
Summary
Orders for nondefense aircraft soared 50.4% m/m (100.6% y/y) in October. That combined with a more than doubling (111.1% y/y) of defense aircraft bookings, caused total durable goods orders to jump 3.4% last month and therefore [...]
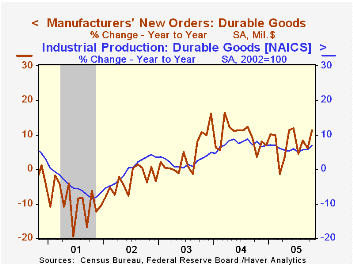
Orders for nondefense aircraft soared 50.4% m/m (100.6% y/y) in October. That combined with a more than doubling (111.1% y/y) of defense aircraft bookings, caused total durable goods orders to jump 3.4% last month and therefore recovered all of the little revised 2.0% decline in September. Consensus expectations had been for a 1.5% rise in October orders.
Less the volatile transportation sector altogether, durable goods orders rose 0.3% after a 0.2% slip in September which was shallower than the decline initially reported.
Orders for nondefense capital goods recovered about two thirds of the prior month's drop with a 6.7% spike. Less aircraft these orders rose 1.3% following a 1.7% September decline that was deeper than initially estimated. 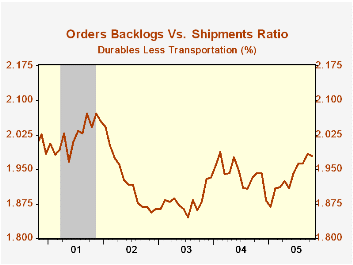
Falling orders for computers & electronic products have been a drag on the capital goods total of late. They fell 1.3% (+5.7% y/y) in October for the third hard decline in the last four months. Computer orders fell 1.7% m/m though the y/y gain of 11.0% was respectable due to a sharp 13.5% jump back in August. Orders for electrical equipment orders also have been erratic, but the trend is up. Despite a 3.5% decline in October (+12.3% y/y) the three month average level rose to its highest since early 2001. Machinery orders, in contrast, have been consistently strong. A 2.1% (8.5% y/y) rise in October pulled the three month average of machinery orders to a record high.
Shipments of durable goods rose 1.4% (6.9% y/y) in October due to broad based industry gains. Less the transportation sector, shipments rose 1.2% (7.5% y/y) with the standout being a 10.0% y/y gain in electrical equipment.
Order backlogs rose a strong 1.5% (12.0% y/y) driven partially by a 2.0% (14.4% y/y) rise in transportation. Less transportation backlogs still were firm for the third straight month, though the ratio of backlogs to shipments did slip slightly from its recent high.
Durable inventories increased 0.4% (4.6% y/y) following an upwardly revised 0.1% Rise in September. The I/S ratio for durable goods fell to its lowest since April of last year.
| NAICS Classification | Oct | Sept | Y/Y | 2004 | 2003 | 2002 |
|---|---|---|---|---|---|---|
| Durable Goods Orders | 3.4% | -2.0% | 11.4% | 9.5% | 4.1% | -3.4% |
| Excluding Transportation | 0.3% | -0.2% | 8.7% | 11.7% | 3.1% | -6.2% |
| Nondefense Capital Goods | 6.7% | -8.6% | 19.4% | 11.0% | 4.2% | -9.8% |
| Excluding Aircraft | 1.3% | -1.7% | 10.7% | 9.5% | 4.8% | -10.5% |
by Tom Moeller November 29, 2005
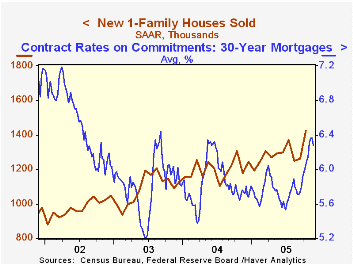
New single-family home sales rose a surprising 13.0% last month to a record 1.424M, adding to upwardly revised levels in September and August. The m/m advance was the strongest since 1993 and the October level by far exceeded Consensus expectations for a decline to 1.20M.
Home sales often strengthen as buyers attempt to beat further increases in interest rates.
Sales were notably strong in the Northeast where a 43.3% (-16.5% y/y) rise recouped nearly all of the prior two months' declines while sales out West recovered all of the prior two months' weakness with a 46.9% (8.8% y/y) jump. Sales in the South rose a lesser 1.9% (27.5% y/y) but that followed gains during the prior two months. In the Midwest, sales reversed much the gain in September with a 9.5% decline that was the fourth decline in five months and left sales down 17.4% versus the May peak.
The median price of a new single family home rose 1.6% m/m (0.9% y/y) after a 2.4% decline in September that was shallower than originally estimated.
The figures from the Census Department reflect home sales counted at the time of sales contract or deposit.
| Homes Sales (000s, AR) | Oct | Sept | Y/Y | 2004 | 2003 | 2002 |
|---|---|---|---|---|---|---|
| New Single-Family | 1,424 | 1,260 | 9.0% | 1,200 | 1,091 | 976 |
by Tom Moeller November 29, 2005
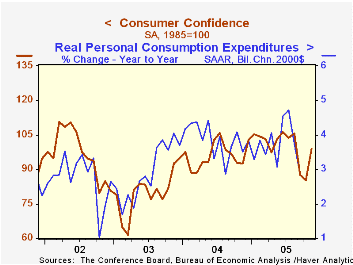
The Conference Board reported that it's November index of Consumer Confidence recovered to the highest level since August. The 16.1% m/m jump contrasted to Consensus expectations for a lesser gain to 90.0 and it was the strongest m/m increase since early 2003. The gain exceeded the 10.0% m/m rebound in Consumer sentiment reported last week by the University of Michigan.
During the last twenty years there has been a 52% correlation between the level of consumer confidence and the y/y change in real consumer spending. The correlation rose to 66% during the last ten years.
The index of consumers' expectations ballooned 26.7% m/m (-1.6% y/y) as optimism rose that during the next six months business conditions would get better, more jobs would be created and that incomes would rise.
Consumers' assessment of the present situation also improved and recovered some of the prior two months' decline (+18.4% y/y). Though an increased percentage of respondents indicated business conditions were good, jobs were viewed as hard to get by a lesser 23.2% of survey participants.
The Conference Board’s survey isconducted by a mailed questionnaire to 5,000 households and about 3,500 typically respond.
| Conference Board | Nov | Oct | Y/Y | 2004 | 2003 | 2002 |
|---|---|---|---|---|---|---|
| Consumer Confidence | 98.9 | 85.2 | 6.8% | 96.1 | 79.8 | 96.6 |
by Tom Moeller November 29, 2005
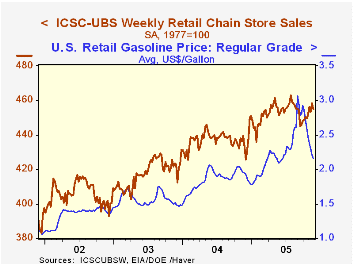
The International Council of Shopping Centers (ICSC)-UBS survey indicated that during Thanksgiving week, chain store sales slipped 0.7% following the prior period's 1.0% jump. The latest left the average level of sales in November 1.2% above October which rose 0.1% from September.
During the last ten years there has been a 51% correlation between the y/y change in chain store sales and the change in non-auto retail sales less gasoline, as published by the US Census Department. Chain store sales correspond directly with roughly 14% of non-auto retail sales less gasoline. The leading indicator of chain store sales from ICSC slipped 0.3% (-2.0% y/y) during the latest week following two consecutive weeks of increases. The ICSC-UBS retail chain-store sales index is constructed using the same-store sales (stores open for one year) reported by 78 stores of seven retailers: Dayton Hudson, Federated, Kmart, May, J.C. Penney, Sears and Wal-Mart.The latest decline in store sales occurred despite a further drop in gasoline prices. The retail average price of gasoline in the U.S. fell a nickel last week to $2.15 (+10.7% y/y).
| ICSC-UBS (SA, 1977=100) | 11/26/05 | 11/19/05 | Y/Y | 2004 | 2003 |
|---|---|---|---|---|---|
| Total Weekly Chain Store Sales | 454.8 | 458.0 | 5.1% | 4.6% | 2.9% |
by Louise Curley November 29, 2005
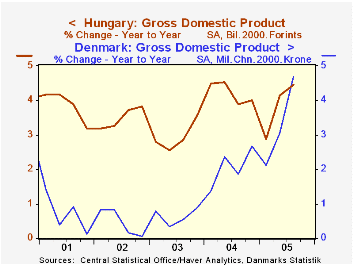
November is probably the busiest month for the release of economic growth estimates for the third quarter in individual countries. Today Gross Domestic Product data for Hungary, Denmark and the Philippines were released. Denmark's GDP was 4.70% above the third quarter of 2005, compared with 4.46% for Hungary and 4.09% for the Philippines. In terms of developed versus developing countries we have Denmark and Hungary in Europe. In terms of the location of developing countries we have Hungary in Eastern Europe and the Philippines in Asia.
First take a look at the year-to-year growth in the developed country, Denmark, and the developing country, Hungary--both in Europe--as shown in the first chart. Over the past five years until the third quarter of this year, Hungary has grown at a significantly higher rate than that of Denmark. In the third quarter, however, Denmark's growth rate was 4.70% compared with Hungary's, 4.46%. Not only has Denmark's growth rate exceeded that of Hungary in the third quarter, but since the second quarter of 2004, growth in Denmark, a non Euro Zone country, has been greater than that of the Euro Zone as a whole. The quarter-to-quarter growth rates so far this year show some weakness in Hungary in contrast to relatively steady advances in Denmark.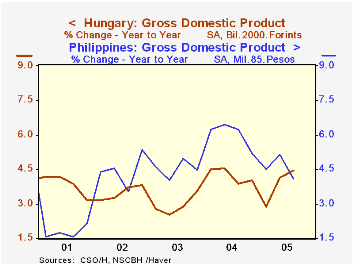
Now, contrast the year-to-year growth rates of the two developing countries in the second chart. The higher growth rate of the Philippines until this last quarter probably reflects the dynamism of the Pacific Rim economies versus the more subdued recoveries of the emerging countries of Eastern Europe. In the third quarter of this year, however, Hungary's economic grew 1% while that of the Philippines was virtually unchanged.
| Growth in Gross Domestic Product | Q3 05 % | Q2 05 % | Q1 05 % | 2004 % | 2003 % | 2002 % |
|---|---|---|---|---|---|---|
| Year-to Year | ||||||
| Denmark | 4.70 | 3.06 | 2.13 | 2.07 | 0.6 | 0.46 |
| Hungary | 4.46 | 4.15 | 2.88 | 4.23 | 2.94 | 3.50 |
| Philippines | 4.09 | 5.15 | 4.49 | 6.02 | 4.51 | 4.45 |
| Quarter-to-Quarter | ||||||
| Denmark | 1.39 | 1.60 | 0.54 | |||
| Hungary | 0.97 | 2.08 | -0.08 | |||
| Philippines | -0.02 | 2.20 | 1.27 |

Tom Moeller
AuthorMore in Author Profile »Prior to joining Haver Analytics in 2000, Mr. Moeller worked as the Economist at Chancellor Capital Management from 1985 to 1999. There, he developed comprehensive economic forecasts and interpreted economic data for equity and fixed income portfolio managers. Also at Chancellor, Mr. Moeller worked as an equity analyst and was responsible for researching and rating companies in the economically sensitive automobile and housing industries for investment in Chancellor’s equity portfolio. Prior to joining Chancellor, Mr. Moeller was an Economist at Citibank from 1979 to 1984. He also analyzed pricing behavior in the metals industry for the Council on Wage and Price Stability in Washington, D.C. In 1999, Mr. Moeller received the award for most accurate forecast from the Forecasters' Club of New York. From 1990 to 1992 he was President of the New York Association for Business Economists. Mr. Moeller earned an M.B.A. in Finance from Fordham University, where he graduated in 1987. He holds a Bachelor of Arts in Economics from George Washington University.
More Economy in Brief


