 Global| Jan 29 2008
U.S. Durable Goods Orders Surged in December, Gain Slowed in 2007
by:Tom Moeller
|in:Economy in Brief
Summary
Orders for durable manufactured goods surged 5.2% last month helped very much by a jump in orders for commercial aircraft. December's rise was the largest m/m gain since July. Nevertheless, a reduced increase in orders for all of 2007 [...]
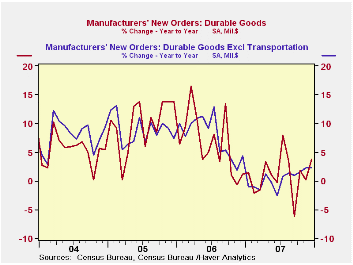
Orders for durable manufactured goods surged 5.2% last month helped very much by a jump in orders for commercial aircraft. December's rise was the largest m/m gain since July. Nevertheless, a reduced increase in orders for all of 2007 highlighted the factory sector's weakness. The 1.0% annual rise in orders was a fraction of the 6.3% gain during the year prior and it was the weakest rise since a decline in 2002. Consensus expectations had been for a smaller gain in December.
Excluding the notably volatile transportation sector, orders
rose 2.6% after a slight decline in November. Again, however, the rise
did little to make up for weakness earlier in the year. As a result,
orders less the transportation sector altogether nudged up just 0.3%,
the weakest annual increase since 2003.
In the transportation sector, orders for aircraft & parts surged 26.2% (23.1% y/y) and that followed an 18.4% November jump. The nondefense portion of those orders rose 11.7% (28.4% y/y) and defense aircraft orders more than doubled m/m (7.1% y/y. Working the other way were orders for motor vehicles & parts which fell 2.3% (-12.4% y/y) and these orders were down 4.6% for the year, the second year of decline.
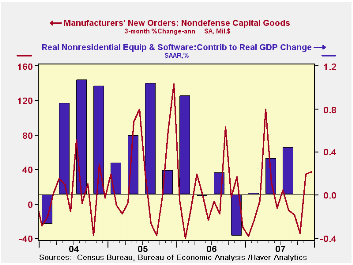
Orders for nondefense capital goods rose 5.4%, about as they did in November. Here again, though, the rise did little to recoup earlier weakness. The m/m gain only lifted the rise for all of last year to a third the rise during 2006. During the last ten years there has been an 80% correlation between the y/y gain in nondefense capital goods orders and the rise in equipment & software spending in the GDP accounts. The correlation with capital goods shipments is, as one would expect, a larger 92%. During December, orders for nondefense capital goods less aircraft posted a 4.4% surge which more than made up declines during the prior two months.
Computers & related products orders rose 4.6% (4.4% y/y) in December and made up about half the weakness during the prior two months. Orders for computers (9.3% y/y) and for communications equipment (9.3% y/y) were strong in the month but for the whole year these orders were down with lower prices.
Orders for machinery surged 7.6% (4.5% y/y). The strong gain at yearend, however, couldn't mask the slowdown in the capital goods sector last year. For the full year these orders rose only 0.7% after gains of 9.6% and 14.4% during the prior two years.
Primary metal orders ended the year with a slight 0.2% slip
(+6.9% y/y). For the year orders rose 3.7%, one third the 2006
increase.Orders for electrical equipment, appliances &
components recovered all of the prior month's decline with a 4.1% (1.8%
y/y) gain.
Overall shipments of durable goods ticked down slightly in December (-0.1% y/y) for the fifth decline in seven months. Less transportation shipments rose 0.4% (2.2% y/y) while these shipments rose just 0.7% for the full year following a 6.6% 2006 increase.
Inventories of durable goods surged 1.1% (3.6% y/y). Indicative of an inventory backup the three month gain rose to 2.3%, its strongest since late last year while less transportation inventories rose 0.5%. The three month increase accelerated to 1.3%, its highest in a year.
| NAICS Classification | December | November | Y/Y | 2007 | 2006 | 2005 |
|---|---|---|---|---|---|---|
| Durable Goods Orders | 5.2% | 0.5% | 1.7% | 1.0% | 6.3% | 9.9% |
| Excluding Transportation | 2.6% | -0.4% | 2.3% | 0.3% | 7.6% | 8.8% |
| Nondefense Capital Goods | 5.4% | 5.3% | 4.4% | 3.4% | 10.6% | 17.1% |
| Excluding Aircraft | 4.4% | -0.2% | 1.3% | -1.6% | 8.5% | 11.1% |
by Tom Moeller January 29, 2008
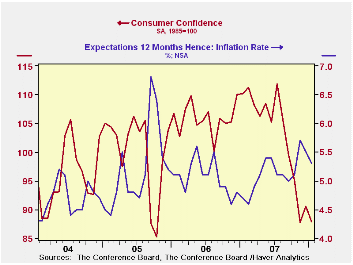
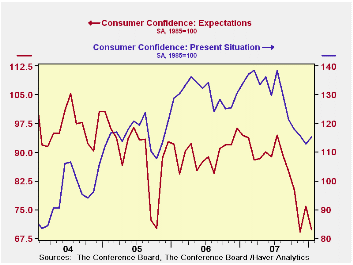
The Conference Board reported today that consumer confidence gave back about all of its December gain. The level fell 3.0% in January to a reading of 87.9. The decline was slightly less than had been expected by economists but it was to a point near the low of last year.
A decline in the expectations component accounted for all of last month's decline with an 8.2% m/m drop. Expectations for employment (more jobs) and for business conditions deteriorated.
 The percentage of respondents planning to buy an existing home
fell but those planning to buy a new home rose to the highest in four
months. Those planning to buy a major appliance rose to the highest
level since August.
The percentage of respondents planning to buy an existing home
fell but those planning to buy a new home rose to the highest in four
months. Those planning to buy a major appliance rose to the highest
level since August.
Respondents planning to buy an automobile within the next six months rose sharply
The present conditions index rose 2.1% and that made up just a small piece of the declines during the last nine months of 2007. Just 20.7% of respondents saw business conditions as good, near the least since 2004, but a slightly greater 23.9% saw jobs as plentiful.
The expected inflation rate in twelve months fell m/m to 5.3% but that still was up from the 5.1% expected rate during 2006 and 2007.
| Conference
Board (SA, 1985=100) |
January | December | Y/Y | 2007 | 2006 | 2005 |
|---|---|---|---|---|---|---|
| Consumer Confidence Index | 87.9 | 90.6 | -20.2% | 103.4 | 105.9 | 100.3 |
| Present Conditions | 115.3 | 112.9 | -13.9% | 128.8 | 130.2 | 116.1 |
| Expectations | 69.6 | 75.8 | -26.3% | 86.4 | 89.7 | 89.7 |
by Louise Curley January 29, 2008
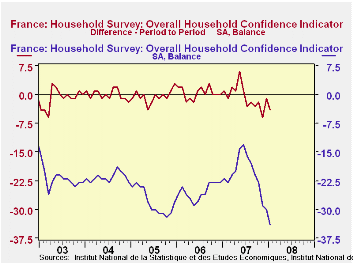
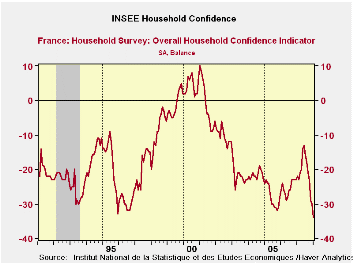
The French National Institute for Statistics and Economic Studies (INSEE) released the results of its survey of consumer confidence today. The summary indicator declined by 4 percentage points in January from December, continuing a series of declines that began in July of last year. The recent increase in inflation added to earlier concerns over the strong euro and the fallout from the sub prime crisis in the U. S. has taken its toll on the French consumers' optimism.
According to INSEE, the level of the balance is not open to direct interpretation; it is the change in the balance that is important. For this reason, we show both the balance and the month to month changes in the balance in the first chart.
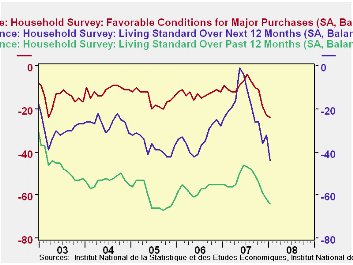
All five of the components of the indicator declined in January. The French consumer's chief concern was the outlook for living standards. The appraisal of the outlook for living standards over the next 12 months fell by 12 basis points. In spite of concerns for future living standards the French consumer saw little change, 1 basis point decline, in the appraisal of the favorability of conditions for major purchases. The second chart shows the appraisal of living standards over the past 12 month and over the next 12 months, together with the appraisal of the favorability of condition for major purchases.
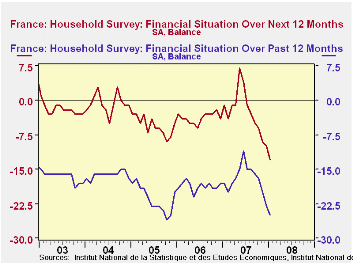
The third chart shows the financial position over the past 12 months and its position over the next 12 months. The financial position over the past 12 months has declined in each month since June 2007 The financial position over the next 12 months has been declining since May and at a faster rate than the financial position of the past 12 months.
| INSEE'S
CONSUMER CONFIDENCE SURVEY (% Balance) |
Jan 08 | Dec 07 | Jan 07 | M/M Dif | Y/Y Dif | 2007 | 2006 | 2005 |
|---|---|---|---|---|---|---|---|---|
| Summary Indicator | -34 | -30 | -22 | -4 | -12 | -21 | -25 | -28 |
| Financial Position over Past 12 months | -25 | -23 | -18 | -2 | -7 | -17 | -19 | -22 |
| Financial Position over Next 12 months | -13 | -10 | -1 | -3 | -12 | -3 | -4 | -6 |
| Living Standards over Past 12 months | -64 | -62 | -55 | -2 | -9 | -53 | -57 | -61 |
| Living Standards over Next 12 months | -44 | -32 | -24 | -12 | -20 | -20 | -34 | -37 |
| Favorable Conditions for Major Purchases | -24 | -23 | -9 | -1 | -15 | -11 | -13 | -15 |
by Robert Brusca January 29, 2008
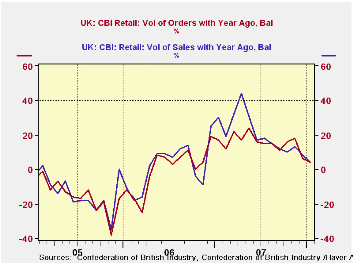
Weakness remains in play in the UK retail sector. In January
the ‘+4’ orders and sales results continue a trend of progressively
weaker net balance results that extends back to early 2007. Still those
readings bested the ‘-5’ for sales and the ‘-9’ for orders that
retailers themselves had expected. So while conditions have steadily
worsened, they have still exceeded the expectations of the
participating retailers themselves, at least in December. Expectations
for sales ‘for the time of year’ were a weak ‘-16’ for January,
however, and that reading resided in the bottom 22 percentile of its
range. Looking ahead to February ‘time of year sales’ is still negative
at ‘-5’, but retailers appear to have scaled back on their pessimism.
Sales and orders compared to a year ago are expected to be in the ‘+10”
range. If so that would pose a bit of a reversal to the ongoing down
trend. But January was the first positive sales surprise in the past
five months and only the second in the past nine. Retailers have had a
reason for their pessimism.
| UK Retail volume data CBI Survey | |||||||||
|---|---|---|---|---|---|---|---|---|---|
| Reported: | Feb 08 |
Jan 08 |
Dec 07 |
Nov 07 |
12Mos Avg | %tile | Max | Min | Range |
| Sales/Year Ago | -- | 4 | 8 | 13 | 19 | 42% | 57 | -35 | 92 |
| Orders/Year Ago | -- | 4 | 6 | 18 | 15 | 53% | 42 | -38 | 80 |
| Sales: Time/Year | -- | 0 | -5 | -3 | 4 | 47% | 41 | -37 | 78 |
| Stocks: Sales | -- | 9 | 24 | 18 | 13 | 30% | 30 | 0 | 30 |
| Expected: | Feb-08 | ||||||||
| Sales/Year Ago | 10 | -5 | 11 | 15 | 16 | 46% | 49 | -23 | 72 |
| Orders/Year Ago | 10 | -9 | 10 | 12 | 11 | 61% | 38 | -34 | 72 |
| Sales: Time/Year | -5 | -16 | 3 | 2 | 3 | 41% | 29 | -29 | 58 |
| Stocks: Sales | 11 | 24 | 11 | 12 | 10 | 38% | 24 | 3 | 21 |
by Robert Brusca January 29, 2008
The ISAE business index is still in a weakening trend. However, it currently only hovers near the midpoint of a range it has occupied over the last eight years.
But looking at the table below we see that the domestic economy is generally in WORSE shape for overall industry as well as each industry segment compared to the foreign sector. Overall the domestic economy order/demand situation is in the 36th percentile of its range. The foreign sector is in the 50th percentile of its range. These comparisons play out like that across industry segments as well.
One interesting conclusion that this suggests is that it is not the strong euro that is crushing Italian industry. Since its greatest weakness comes from the domestic economy, Italy’s biggest problems seem to be home-grown. One problem may be that jobs are just not paying what they should and growth in jobs is not what it should be to support business at home. Certainly Italian consumer confidence is very weak. And through that channel the international economy is being felt, but in a more structural way, not in a cyclical currency way. Since Italian firms seem to be doing better abroad than at home the euro per se does not appear to be the proximate cause of its weakness. Internationalization and competition in general may be root problems. Competitiveness may be an issue but if it is, it is an issue in a structural sense. And that will be a tougher problem to solve than a too-strong euro.
Italy, like France and Germany, shows that one of the weakest portions of the economy continues to be the consumer sector. There, the domestic order situation is in the bottom 22nd percentile of its range compared with a nearly as weak 23rd percentile for overseas orders. Production is in its 22nd percentile. The sector is the weakest overall among Italian industries.>
The theme of a weak consumer/consumer-serving sector is one of
the most durable across the Euro Area.
| Italy ISAE Business Sentiment | ||||||||||
|---|---|---|---|---|---|---|---|---|---|---|
| Since January 1999 | ||||||||||
| Jan 08 |
Dec 07 |
Nov 07 |
Oct 07 |
%tile | Rank | Max | Min | Range | Mean | |
| Biz Confidence | 91.6 | 91.7 | 92.1 | 92.8 | 52.1 | 47 | 102 | 81 | 21 | 92 |
| TOTAL INDUSTRY | ||||||||||
| Order books & Demand | ||||||||||
| Total | -6 | -6 | -7 | -6 | 52.5 | 35 | 13 | -27 | 40 | -9 |
| Domestic | -15 | -9 | -11 | -9 | 36.6 | 56 | 11 | -30 | 41 | -12 |
| Foreign | -11 | -6 | -9 | -10 | 50.0 | 44 | 11 | -33 | 44 | -13 |
| Inventories | 5 | 6 | 7 | 8 | 66.7 | 51 | 13 | -11 | 24 | 4 |
| Production | -12 | -4 | -4 | -3 | 30.6 | 70 | 22 | -27 | 49 | -6 |
| INTERMEDIATE | ||||||||||
| Order books & Demand | ||||||||||
| Total | -13 | -13 | -11 | -9 | 41.8 | 54 | 19 | -36 | 55 | -10 |
| Domestic | -17 | -15 | -12 | -11 | 31.3 | 62 | 16 | -32 | 48 | -12 |
| Foreign | -13 | -13 | -10 | -9 | 46.6 | 51 | 18 | -40 | 58 | -12 |
| Inventories | 3 | 6 | 7 | 4 | 62.1 | 38 | 14 | -15 | 29 | 0 |
| Production | -14 | -11 | -5 | -5 | 29.3 | 70 | 27 | -31 | 58 | -7 |
| INVESTMENT GOODS | ||||||||||
| Order books & Demand | ||||||||||
| Total | 1 | 4 | 4 | 8 | 53.7 | 35 | 32 | -35 | 67 | -5 |
| Domestic | -5 | 0 | -6 | 4 | 49.2 | 33 | 25 | -34 | 59 | -11 |
| Foreign | -1 | 2 | -1 | -3 | 55.6 | 35 | 23 | -31 | 54 | -7 |
| Inventories | 4 | 3 | 6 | 14 | 56.8 | 46 | 20 | -17 | 37 | 2 |
| Production | -1 | 6 | 5 | 13 | 45.5 | 40 | 35 | -31 | 66 | -1 |
| CONSUMER GOODS | ||||||||||
| Order books & Demand | ||||||||||
| Total | -18 | -5 | -10 | -13 | 21.4 | 78 | 15 | -27 | 42 | -10 |
| Domestic | -21 | -8 | -15 | -16 | 17.1 | 85 | 8 | -27 | 35 | -12 |
| Foreign | -24 | -11 | -15 | -17 | 23.4 | 80 | 12 | -35 | 47 | -15 |
| Inventories | 6 | 5 | 8 | 9 | 65.4 | 47 | 15 | -11 | 26 | 4 |
| Production | -17 | -2 | -8 | -12 | 22.2 | 86 | 11 | -25 | 36 | -7 |
| Total number of months: | 100 | |||||||||

Tom Moeller
AuthorMore in Author Profile »Prior to joining Haver Analytics in 2000, Mr. Moeller worked as the Economist at Chancellor Capital Management from 1985 to 1999. There, he developed comprehensive economic forecasts and interpreted economic data for equity and fixed income portfolio managers. Also at Chancellor, Mr. Moeller worked as an equity analyst and was responsible for researching and rating companies in the economically sensitive automobile and housing industries for investment in Chancellor’s equity portfolio. Prior to joining Chancellor, Mr. Moeller was an Economist at Citibank from 1979 to 1984. He also analyzed pricing behavior in the metals industry for the Council on Wage and Price Stability in Washington, D.C. In 1999, Mr. Moeller received the award for most accurate forecast from the Forecasters' Club of New York. From 1990 to 1992 he was President of the New York Association for Business Economists. Mr. Moeller earned an M.B.A. in Finance from Fordham University, where he graduated in 1987. He holds a Bachelor of Arts in Economics from George Washington University.
More Economy in Brief


