 Global| Apr 23 2010
U.S. Durable Goods Orders SlumpWith Aircraft
by:Tom Moeller
|in:Economy in Brief
Summary
Durable goods orders figures can be volatile month-to-month, thus discerning trends can be challenging. The latest figures present that difficulty. March orders slid 1.3% after a revised 1.1% February increase. Consensus expectations [...]
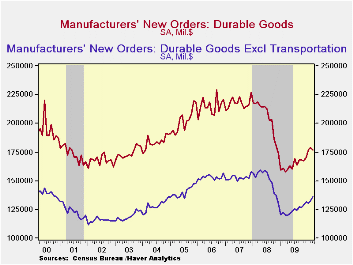
Durable goods orders figures can be volatile month-to-month, thus discerning trends can be challenging. The latest figures present that difficulty. March orders slid 1.3% after a revised 1.1% February increase. Consensus expectations had been for a 0.2% uptick. These numbers on the surface give the appearance of a stall in the factory sector's improvement. However, volatility of big-ticket aircraft orders accounts for much of the variation. They slid 42.2% m/m as nondefense aircraft orders plunged by two-thirds (-10.1% y/y).
In addition, a 2.5% increase (5.3% y/y) in March motor vehicle orders made up declines in the prior two months. Excluding the transportation sector altogether, durable goods orders continued to firm after the recent recession. A 2.8% rise last month (13.5% y/y) was the fourth strong gain in five months and the 13.5% y/y surge was the strongest since mid-2006. As a result, further strength in shipments and production of manufactured durable goods is likely.
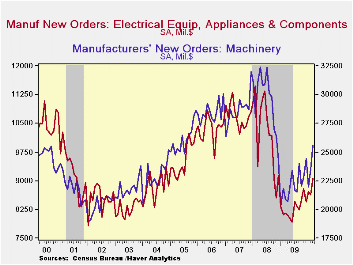
Improvement in other sectors of durable manufacturing continued last month, and it was broad-based. Primary metals orders increased 3.5% and they're up by one-half from last March. Machinery orders rose 8.6% (22.3% y/y) for the fourth strong gain in five months while electrical equipment orders jumped 4.9% (11.0% y/y). The technology sector also improved. Orders for computers & related equipment jumped 3.4% (6.9% y/y).
Shipments of durable goods followed the gains in orders and they posted a 1.2% increase (4.8% y/y) after two months of slight decline. Shipments of primary metals led the gain with a 4.4% increase (33.7% y/y) along with a 4.3% jump in machinery shipments (2.4% y/y). A 1.9% increase (0.2% y/y) in transportation sector shipments along with a 1.1% rise (2.8% y/y) in electrical equipment. Shipments of computers & electronic products lagged and posted a 2.3% decline (+8.0% y/y), the fourth in five months. Semiconductor shipments were notably weak (10.7% y/y) for the second consecutive month.
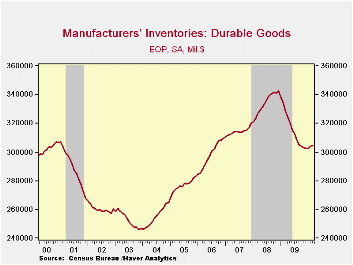
A turn away from inventory decumulation is helping the factory sector's improvement. Durable goods inventories rose 0.2% (-7.2% y/y) for the third month of modest increase. Nevertheless, inventories remained well below past levels. Since the December 2008 peak inventories were down 11.1%. Finally, backlogs of durable goods orders slipped 0.3% and remained down 5.2% y/y.
The durable goods figures are available in Haver's USECON database.
| NAICS Classification (%) | March | February | January | Y/Y | 2009 | 2008 | 2007 |
|---|---|---|---|---|---|---|---|
| Durable Goods Orders | -1.3 | 1.1 | 3.8 | 11.9 | -19.8 | -6.0 | 1.4 |
| Excluding Transportation | 2.8 | 1.7 | -0.8 | 13.5 | -17.3 | -1.4 | -0.3 |
| Nondefense Capital Goods | -7.5 | 6.1 | 3.9 | 12.7 | -23.9 | -7.0 | 3.6 |
| Excluding Aircraft | 4.0 | 2.1 | -4.4 | 12.6 | -18.2 | -0.5 | -2.7 |
by Robert Brusca April 23, 2010
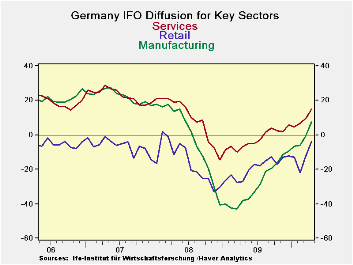
IFO surges: Germany’s IFO indicators are rising very sharply in April. The biz climate index lies 6.5% above its average; the Biz expectations index lies some 8.2% above its average mark as well. Biz expectations a positioned in the 94.5th percentile of their range, an extremely high standing, while current conditions are only at the 51.2 percentile’ just above the mid-point.
Sectors are strong: Services, retailing, and MFG sectors all are advancing with retailing making a strong move in the past month after having languished badly. The MFG sector is driving higher at a consistent and vibrant pace.
Report aligns with strength elsewhere despite irregularities in e-Zone - The IFO report reinforces the strong readings earlier by the Zew survey of financial experts. It is a survey for April and is very up-to-date. e-Zone orders though March were released today and were also quite solid. The UK, however, reported a somewhat disappointing Q2 GDP gain. Greece threw in the towel and asked for aid. Obviously the EU/EMU is a melting pot of differing economic circumstances.
Strength seems to dominate worries: For now the good news is that the German economy is firing on all cylinders. The MFG sector continues to be strong and the retailing sector has started to show some strong gains at long last. The Markit indices on services and MFG were not just up in April, but were up strongly. On the back of that strong report from Markit we can conclude that the growth prospects for Europe are looking up despite the irregularities and challenges it faces.
| IFO Survey: Germany | |||||||||
|---|---|---|---|---|---|---|---|---|---|
| Percent: Yr/Yr | INDEX NUMBERS | ||||||||
| Apr 10 |
Mar 10 |
Feb 10 |
Jan 10 |
Dec 09 |
CURRENT | Mar 10 |
Curr/Avg | Percentile | |
| Biz Climate | 21.5% | 19.6% | 15.2% | 15.5% | 14.8% | 101.6 | 98.2 | 106.5% | 72.8% |
| Current Situation | 19.4% | 14.5% | 6.5% | 5.3% | 2.1% | 99.3 | 94.5 | 104.6% | 51.2% |
| Biz Expectations | 23.8% | 24.8% | 24.4% | 26.8% | 28.9% | 104.0 | 102.0 | 108.2% | 94.5% |
| Average & Range Since Jul-92 | |||||||||
by Tom Moeller April 23, 2010
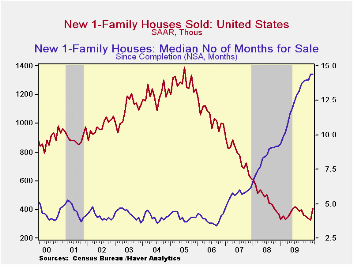
It's not that an $8,000 home-buyer tax credit alone lifted March new home sales, it's that it will no longer be offered by the Federal government after next week.The result was that new home sales jumped 26.9% from February to 411,000 (AR). March sales were the highest level since last July but it followed four consecutive months of decline. The latest greatly exceeded of Consensus expectations for 325,000 sales.
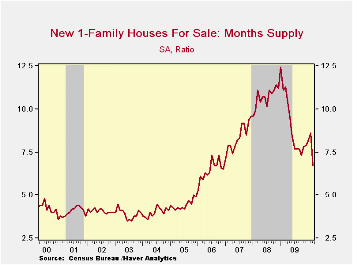
Home prices dipped last month, but that followed a firm February increase. The net-result was a 4.3% price increase versus last March which was the cycle low. Nevertheless, prices remain down 18.5% from the 2007 peak.Price discounts have been lowering the inventory of unsold homes to its lowest level since 1991. At the current sales rate, the months' supply of unsold homes dropped to 6.7 from its 2009 high of 12.4 months. However, despite all this improvement it still took a record median 14.4 months to sell a new home as of March.
A rebound from severe winter weather probably helped sales in the Northeast. They rose by more than one-third from February and were double last year's level. That monthly increase failed, however, to make up the February decline. Sales in South also showed a hefty 43.5% rise m/m but were up just 18.5% from last March. Elsewhere, the credit's positive effect seemed smaller. Sales in the West sales rose 5.7% but they were up by one-quarter from last year while sales in the Mid-west rose just 4.3% after a 13.0% February decline.

| US New Homes | March | February | January | Y/Y | 2009 | 2008 | 2007 |
|---|---|---|---|---|---|---|---|
| Total Sales (SAAR, 000s) | 411 | 324 | 338 | 23.8% | 372 | 481 | 769 |
| Northeast | 38 | 28 | 41 | 100.0 | 31 | 35 | 64 |
| Midwest | 49 | 47 | 54 | 11.4 | 54 | 69 | 118 |
| South | 231 | 161 | 168 | 18.5 | 201 | 264 | 409 |
| West | 93 | 88 | 75 | 25.7 | 87 | 113 | 178 |
| Median Price (NSA, $) | 214,000 | 221,600 | 215,800 | 4.3 | 214,500 | 230,408 | 243,742 |

Tom Moeller
AuthorMore in Author Profile »Prior to joining Haver Analytics in 2000, Mr. Moeller worked as the Economist at Chancellor Capital Management from 1985 to 1999. There, he developed comprehensive economic forecasts and interpreted economic data for equity and fixed income portfolio managers. Also at Chancellor, Mr. Moeller worked as an equity analyst and was responsible for researching and rating companies in the economically sensitive automobile and housing industries for investment in Chancellor’s equity portfolio. Prior to joining Chancellor, Mr. Moeller was an Economist at Citibank from 1979 to 1984. He also analyzed pricing behavior in the metals industry for the Council on Wage and Price Stability in Washington, D.C. In 1999, Mr. Moeller received the award for most accurate forecast from the Forecasters' Club of New York. From 1990 to 1992 he was President of the New York Association for Business Economists. Mr. Moeller earned an M.B.A. in Finance from Fordham University, where he graduated in 1987. He holds a Bachelor of Arts in Economics from George Washington University.
More Economy in Brief


