 Global| Jan 29 2009
U.S. Durable Goods Orders Slumped Further
by:Tom Moeller
|in:Economy in Brief
Summary
The factory sector continued to be hard hit by recession last month. New orders for durable goods fell during December for the fourth month in the last five. The 2.6% drop followed declines of 3.7% in November and 8.5% during October. [...]
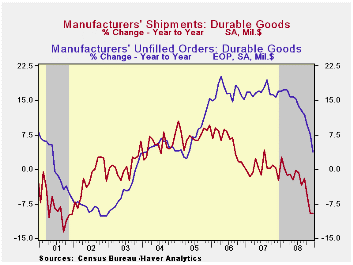
The factory sector continued to be hard hit by recession last month. New orders for durable goods fell during December for the fourth month in the last five. The 2.6% drop followed declines of 3.7% in November and 8.5% during October. But since July new orders have plummeted 19.0%, the largest five-month drop since 1975. The December decline far exceeded Consensus expectations for a 2.0% shortfall.
Lower new orders for computers & electronic products led last month's decline with a 7.2% drop (-10.0% y/y). Orders for just computers & related products were quite weak, down 3.0% for the month and off 19.6% during the last twelve months. New orders for communications equipment also were down by a significant 4.9% (-9.9% y/y).
Severe weakness showed through in other industries. Orders for primary metals fell 6.9% last month and they're down 28.7% during the last twelve. Machinery orders fell hard for the fourth month in the last five and they are off 18.3% for the year. Electrical equipment bookings actually rose 9.4% last month but they're down by that amount December-to-December.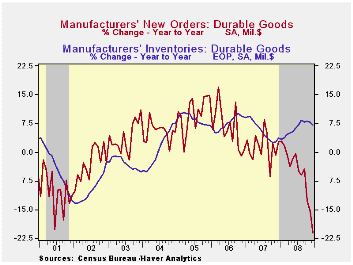
Capital equipment orders fell just 1.1%, but the 23.8% y/y decline reflected a 27.0% y/y drop in orders for nondefense capital goods. That decline was due to the severe weakness in aircraft orders which nearly halved last year. Still, without aircraft, nondefense capital goods orders were down a sharp 11.2% y/y to their lowest level since 2005. During the last ten years there has been an 80% correlation between the y/y change in nondefense capital goods orders and the change in equipment & software spending in the GDP accounts. The correlation of the GDP figure with capital goods shipments is, as one would expect, a larger 92%.
Reflecting this weakness in new orders was overall shipments of durable goods. They fell 0.7% last month and were down 9.5% for the year. For comparison, industrial production of durable goods fell 12.8% during 2008. During the last ten years there has been an 81% correlation between the twelve-month change in shipments of durable goods and the change in durables industrial production. Less transportation, shipments of durable goods fell 1.4% last month, off 7.0% for the year.
Lower orders have led inventories to back up. Inventories of manufactured durables rose 0.4% in December and the 7.0% y/y rate of increase has been fairly stable since the summer. That has been accompanied by lower order backlogs which have fallen sharply during the last three months. The year-to-year rise of 3.9% is the weakest since 2005.
| NAICS Classification (%) | December | November | Y/Y | 2008 | 2007 | 2006 |
|---|---|---|---|---|---|---|
| Durable Goods Orders | -2.6 | -3.7 | -21.1 | -5.6 | 1.4 | 6.2 |
| Excluding Transportation | -3.6 | -1.7 | -14.0 | -1.0 | -0.3 | 9.1 |
| Nondefense Capital Goods | -5.9 | -4.6 | -27.2 | -6.4 | 3.5 | 9.4 |
| Excluding Aircraft | -2.8 | 1.7 | -11.2 | 0.1 | -2.7 | 10.7 |
by Tom Moeller January 29, 2009
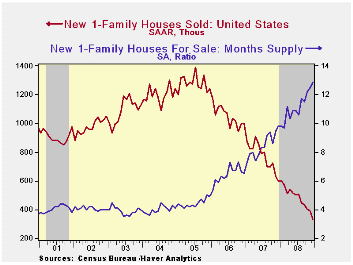
Last month, sales of new single-family homes fell to their lowest level in the series' history which dates back to 1963. The 14.7% m/m December decline to 331,000 followed a downwardly revised November. December-to-December, new home sales were off by half and down by three-quarters from their peak during July 2005. They fell short of Consensus expectations for 400,000.
December-to-December sales fell hard around the country, down by one-third to one-half.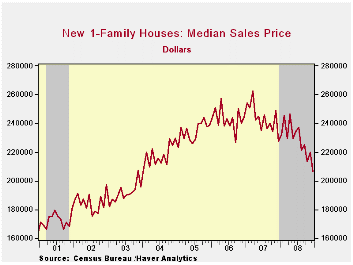
The median price for a new single-family home continued to fall hard to $206,500 as homebuilders attempted to move inventory. In fact, that effort has been quite successful and the inventory of unsold homes is down by more than one-quarter during the last year to its lowest level since 2003. In each of the country's regions, the inventory is down by roughly one-quarter during the last year.
The month's supply of new homes for sale surged to 12.9, a record.New Adjustable-Rate Mortgages and the Libor Surprise From the Federal Reserve Bank of Cleveland can be found here.
| US New Homes | December | November | Y/Y (%) | 2008 | 2007 | 2006 |
|---|---|---|---|---|---|---|
| Total Sales (SAAR, 000s) | 331 | 388 | -44.8 | 479 | 768 | 1,049 |
| Northeast | 28 | 39 | -50.0 | 35 | 64 | 64 |
| Midwest | 51 | 54 | -31.1 | 69 | 118 | 161 |
| South | 181 | 206 | -46.0 | 264 | 408 | 559 |
| West | 71 | 89 | -47.4 | 111 | 178 | 266 |
| Median Price (NSA, $) | 206,500 | 219,700 | -9.3 | 228,350 | 243,742 | 243,067 |
by Tom Moeller January 29, 2009

The labor market remained under pressure last week as indicated by another rise in continuing claims for unemployment insurance. During the week of January 17 they rose 159,000 and that followed an upwardly revised 102,000 increase during the prior period. To emphasize the labor market's weakness, the latest increase raised continuing claims above their 1982 high to a new record for the series which dates back to 1966. The four-week average of continuing claims rose 66,500 to 4,630,000. Continuing claims provide some indication of workers' ability to find employment and they lag the initial claims figures by one week.
Though the latest level of continuing claims was a record, the labor force has grown as well. Therefore, the insured rate of unemployment was not at a new high. It did, however, rise to 3.6%, the highest since 1983. The highest insured unemployment rates in the week ending January 10 were in Michigan (7.3 percent), Oregon (6.7), Idaho (6.5), South Carolina (6.0), Pennsylvania (5.8), Wisconsin (5.7), Indiana (5.5), Nevada (5.3), Montana (5.2), Puerto Rico (5.2), and Rhode Island (5.2).
Initial claims for unemployment insurance also pointed to severe labor market weakness with a 3,000 rise to 588,000 during last week. The prior week's gain was revised down slightly but the latest level surpassed Consensus expectations for 575,000 claims. It was the highest since late during the sharp recession of 1981-82. During that recession, real GDP fell by 2.9% peak-to-trough.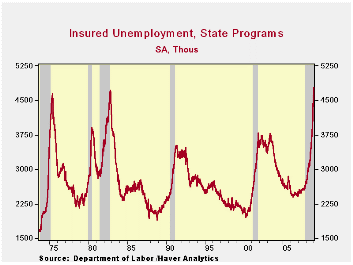
The Labor Department indicated that the largest increases in initial claims for the week ending January 17 were in Florida (+6,500), California (+1,826), Puerto Rico (+1,308), Texas (+537), and Massachusetts (+86), while the largest decreases were in Michigan (-33,365), North Carolina (-25,516), Georgia (-12,635), New York (-12,432), and Pennsylvania (-10,077).
World Growth Grinds to Virtual Halt, IMF Urges Decisive Global Policy Response. The report from the International Monetary Fund can be found here.
Behavior of Libor in the Current Financial Crisis from the Federal Reserve Bank of San Francisco can be found here.
| Unemployment Insurance (000s) | 01/24/09 | 01/17/09 | 01/10/09 | Y/Y | 2008 | 2007 | 2006 |
|---|---|---|---|---|---|---|---|
| Initial Claims | 588 | 585 | 527 | 60.7% | 420 | 321 | 313 |
| Continuing Claims | -- | 4,776 | 4,617 | 76.7% | 3,342 | 2,552 | 2,459 |

Tom Moeller
AuthorMore in Author Profile »Prior to joining Haver Analytics in 2000, Mr. Moeller worked as the Economist at Chancellor Capital Management from 1985 to 1999. There, he developed comprehensive economic forecasts and interpreted economic data for equity and fixed income portfolio managers. Also at Chancellor, Mr. Moeller worked as an equity analyst and was responsible for researching and rating companies in the economically sensitive automobile and housing industries for investment in Chancellor’s equity portfolio. Prior to joining Chancellor, Mr. Moeller was an Economist at Citibank from 1979 to 1984. He also analyzed pricing behavior in the metals industry for the Council on Wage and Price Stability in Washington, D.C. In 1999, Mr. Moeller received the award for most accurate forecast from the Forecasters' Club of New York. From 1990 to 1992 he was President of the New York Association for Business Economists. Mr. Moeller earned an M.B.A. in Finance from Fordham University, where he graduated in 1987. He holds a Bachelor of Arts in Economics from George Washington University.
More Economy in Brief


