 Global| May 28 2009
U.S. Durable Goods Orders Recover Earlier Decline And Are Up Slightly 'YTD
by:Tom Moeller
|in:Economy in Brief
Summary
Perhaps the factory sector's distress is nearing its end. At least some moderation of last year's woes was evident in the latest report of durable goods orders. During April orders rose 1.9% following a 2.1% March decline which was [...]
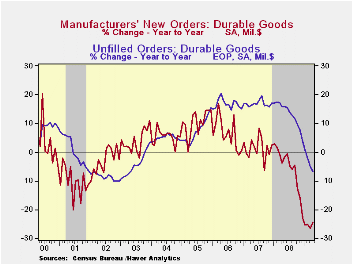
Perhaps the factory sector's distress is nearing its end. At least some moderation of last year's woes was evident in the latest report of durable goods orders. During April orders rose 1.9% following a 2.1% March decline which was greater than reported initially. Consensus expectations were for a 0.5% April increase and during the last three months orders have risen at a 1.4% annual rate.That follows a 5.8% decline during all of last year.
A 5.4% rise (-27.5% y/y) in transportation equipment orders led last month's increase in total durables bookings after having been unchanged during March. Orders for motor vehicles & parts recovered 2.4% (-24.7% y/y) for the first monthly increase since last September. Machinery orders also rose but by a lesser 2.4% (-33.4% y/y) and electrical equipment orders ticked up 0.3% (-24.9% y/y). Orders for computers & electronic products, however, worked lower again and fell 2.7% (-10.9% y/y). Finally, primary metals bookings did increase 1.0% for the month but remained down by one-half from April of last year.
As is common during recession, the capital goods sector will
lag any improvement in new orders for early cycle products. As such,
orders for nondefense capital goods fell 2.0% last month and they have
fallen in nearly each month since early last year. Orders excluding
aircraft also fell by 1.5% during April and they are down by
one-quarter over the last year. During the last ten years there has
been an 80% correlation between the y/y change in nondefense capital
goods orders and the change in equipment & software spending in
the GDP accounts. The correlation of the GDP figure with capital goods
shipments is, as one would expect, a larger 92%.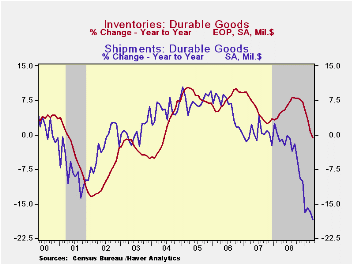
Shipments of durable goods continued lower and slipped 0.2% last month (-18.4% y/y). They have fallen at a 22.8% annual rate so far this year and the decline has been accompanied by a like three-month rate of decline in industrial production of durable goods. During the last ten years, there has been an 80% correlation between the change in shipments of durable goods and the change in durables industrial production.
Inventories of durable goods fell for the fourth consecutive month. The 0.8% decline was the fourth in a row and it brought the annual rate of change to -13.7%, the quickest since 2001. Decumulation of metals and machinery inventories has been notably fast. Backlogs in order books have fallen in each of the last seven months and during the last year by 6.7%, a rate of decline which is the sharpest since 2003.
The durable goods figures are available in Haver's USECON database.
Recession and Recovery Across the Nation: Lessons from History from the Federal Reserve Bank of Kansas City is available here.
| NAICS Classification (%) | April | March | Y/Y | 2008 | 2007 | 2006 |
|---|---|---|---|---|---|---|
| Durable Goods Orders | 1.9 | -2.1 | -24.4 | -5.8 | 1.4 | 6.2 |
| Excluding Transportation | 0.8 | -2.7 | -23.3 | -1.2 | -0.3 | 9.1 |
| Nondefense Capital Goods | -2.0 | -0.9 | -32.8 | -6.8 | 3.5 | 9.4 |
| Excluding Aircraft | -1.5 | -1.4 | -24.4 | -0.3 | -2.7 | 10.7 |
by Tom Moeller May 28, 2009

Sales of new single-family homes during April showed further
signs of forming a bottom after having declined by more than
three-quarters since 2005. Sales were stable at 352,000 units (AR)
after a downwardly revised March decline. They have varied in a range
of 329,000 to 362,000 so far this year. April sales fell short of
Consensus expectations for 360,000 units. 
Around the country sales patterns vary. Sales in Midwest were stable last month near their record low while sales in the Northeast also were stable at a new record low. Sales in the South picked up slightly as did sales out West.
The modest firming of home sales gave rise to an increase in the median price for a new single-family home. At $209,700 the figure was at its highest since November, however, that increase may be due to a usual seasonal gain. Since their peak early in 2007, new home prices have fallen by roughly one-quarter.
Price weakness has helped move the inventory of unsold homes. It's down by nearly one-half since the peak during 2006 and at the lowest level since 2001. In each of the country's regions, the inventory is down by roughly one-third just during the last year.The month's supply of new homes for sale also has started to drop, in April to the lowest level since last July. But there's more inventory to move with lower prices if sales remain low.
The new home sales figures are available in Haver's USECON database.
| US New Homes | April | March | Y/Y (%) | 2008 | 2007 | 2006 |
|---|---|---|---|---|---|---|
| Total Sales (SAAR, 000s) | 352 | 351 | -34.0 | 479 | 768 | 1,049 |
| Northeast | 19 | 19 | -52.5 | 35 | 64 | 64 |
| Midwest | 45 | 45 | -45.8 | 69 | 118 | 161 |
| South | 212 | 206 | -25.4 | 264 | 408 | 559 |
| West | 76 | 79 | -39.7 | 111 | 178 | 266 |
| Median Price (NSA, $) | 209,700 | 202,200 | -14.9 | 230,408 | 243,742 | 243,067 |
by Tom Moeller May 28, 2009
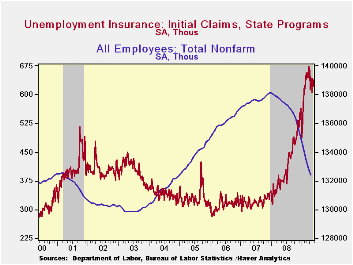
Another tenuous sign improvement in the labor market came from last week's decline in initial claims for unemployment insurance, down a modest 13,000 to 623,000. That followed an upwardly revised level during the prior week of 636,000. Though still at a high level, initial claims are down from their March peak of 674,000. The four-week average of claims, which smoothes out some of the volatility in the weekly numbers, ticked down to 626,750, near the lowest level since mid-February. The Consensus expectation was for 630,000 claims last week.
The Labor Department indicated that the largest increases in
initial claims for the week ending May 16 were in California (+5,447),
North Carolina (+2,693), Georgia (+1,595), Washington (+764), and
Florida (+528), while the largest decreases were in Michigan (-9,758),
Kentucky (-4,323), Illinois (-3,425), Indiana (-3,081), and Ohio
(-2,522).
Despite the improvement in initial claims, the job market remains notably weak. Continuing claims for unemployment insurance, which provide an indication of workers' ability to find employment increased to another record high of 6,788,000, more than twice the year ago level. The series dates back to 1966. Further indicating that the job market remains weak, the four-week average of continuing claims also rose to another record of 6,608,250.
The lack of hiring continued to push the insured unemployment rate higher to 5.1%. That level was more than double last April and the highest level since 1983. During the last ten years there has been a 93% correlation between the level of the insured unemployment rate and the overall rate of unemployment published by the Bureau of Labor Statistics.Clearly, the latest weekly figure understates labor market distress in some states. The highest insured unemployment rates in the week May 9 were in Oregon (7.3 percent), Michigan (7.1), Nevada (6.4), Pennsylvania (6.4), Puerto Rico (6.2), Wisconsin (6.0), Idaho (5.7), California (5.5), North Carolina (5.5), and Illinois (5.4).
The unemployment insurance claims data is available in Haver's WEEKLY database.
The recession in perspective from the Federal Reserve Bank of Minneapolis can be found here.
| Unemployment Insurance (000s) | 05/23/09 | 05/16/09 | 05/09/09 | Y/Y | 2008 | 2007 | 2006 |
|---|---|---|---|---|---|---|---|
| Initial Claims | 623 | 636 | 643 | 64.8% | 420 | 321 | 313 |
| Continuing Claims | -- | 6,788 | 6,678 | 118.8% | 3,342 | 2,552 | 2,459 |
by Robert Brusca May 27, 2009
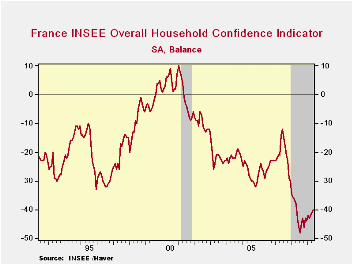
The French consumer is gradually beginning to feel better. At
a value of -40, confidence is up by a tick in May following a one point
rising trends that is in place for several months.
The index is still low in the bottom 13 percentile of its
range since 1990. Consumers are will as worried as they ever have been
abut unemployment.. Inflation is not a concern. The current financial
situation is in the lower 38Th percentile of its range an improvement
over the bottom 25th percentile for the previous 12-months.
This is yet another reading on the consumer making progress in
the right direction but at a slow pace.
| INSEE Household Monthly Survey | ||||||||||
|---|---|---|---|---|---|---|---|---|---|---|
| Since Jan 1990 | Since Jan 1990 | |||||||||
| May 09 |
Apr 09 |
Mar 09 |
Feb-09 | Percentile | Rank | Max | Min | Range | Mean | |
| Household Confidence | -40 | -41 | -42 | -43 | 13.8 | 214 | 10 | -48 | 58 | -19 |
| Living Standards | ||||||||||
| Past 12 Mos | -76 | -76 | -76 | -76 | 6.0 | 216 | 18 | -82 | 100 | -40 |
| Next 12-Mos | -51 | -54 | -59 | -58 | 10.7 | 215 | 16 | -59 | 75 | -21 |
| Unemployment: Next 12 | 88 | 83 | 79 | 81 | 100.0 | 1 | 88 | -37 | 125 | 32 |
| Price Developments | ||||||||||
| Past 12Mo | -17 | -12 | -7 | -2 | 33.1 | 101 | 64 | -57 | 121 | -16 |
| Next 12-Mos | -55 | -53 | -51 | -46 | 5.4 | 224 | 33 | -60 | 93 | -35 |
| Savings | ||||||||||
| Favorable to save | 7 | 9 | 14 | 13 | 28.9 | 220 | 39 | -6 | 45 | 22 |
| Ability to save Next 12 | -20 | -15 | -12 | -18 | 10.3 | 221 | 6 | -23 | 29 | -9 |
| Spending | ||||||||||
| Favorable for major purchase | -28 | -30 | -29 | -33 | 24.1 | 194 | 16 | -42 | 58 | -14 |
| Financial Situation | ||||||||||
| Current | 11 | 12 | 12 | 11 | 38.1 | 116 | 24 | 3 | 21 | 12 |
| Past 12 MOs | -28 | -27 | -28 | -29 | 25.8 | 214 | -5 | -36 | 31 | -17 |
| Next 12-Mos | -17 | -18 | -20 | -20 | 20.0 | 213 | 11 | -24 | 35 | -2 |
| Number of observations in the period : 226 | ||||||||||

Tom Moeller
AuthorMore in Author Profile »Prior to joining Haver Analytics in 2000, Mr. Moeller worked as the Economist at Chancellor Capital Management from 1985 to 1999. There, he developed comprehensive economic forecasts and interpreted economic data for equity and fixed income portfolio managers. Also at Chancellor, Mr. Moeller worked as an equity analyst and was responsible for researching and rating companies in the economically sensitive automobile and housing industries for investment in Chancellor’s equity portfolio. Prior to joining Chancellor, Mr. Moeller was an Economist at Citibank from 1979 to 1984. He also analyzed pricing behavior in the metals industry for the Council on Wage and Price Stability in Washington, D.C. In 1999, Mr. Moeller received the award for most accurate forecast from the Forecasters' Club of New York. From 1990 to 1992 he was President of the New York Association for Business Economists. Mr. Moeller earned an M.B.A. in Finance from Fordham University, where he graduated in 1987. He holds a Bachelor of Arts in Economics from George Washington University.
More Economy in Brief


