 Global| Sep 27 2005
U.S. Durable Goods Orders Rebounded
by:Tom Moeller
|in:Economy in Brief
Summary
US durable goods orders in August recouped much of the prior month's decline with a 3.3% rise that far exceeded Consensus expectations for a 0.8% increase. The volatility of orders in the transportation sector recently has been [...]
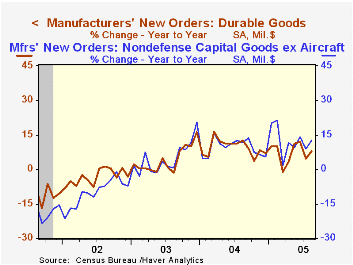
US durable goods orders in August recouped much of the prior month's decline with a 3.3% rise that far exceeded Consensus expectations for a 0.8% increase.
The volatility of orders in the transportation sector recently has been extreme. In August, a 10.4% rise in aircraft orders followed an 18.8% July decline. Less transportation altogether, durable goods orders rose 4.2% last month to a record high.
Strength in nondefense capital goods orders also has been somewhat masked by the volatility in the transportation sector. Overall nondefense capital goods orders last month recovered most of the prior month's decline with a 4.3% increase but less aircraft these orders rose 3.6% to the highest level since 2000.
Electrical equipment orders rose a notable 8.1% (10.6% y/y) last month while machinery orders increased 3.5% (8.2% y/y). Computer & electronic products orders increased 5.5% (14.7% y/y) goosed by a 10.7% (26.4% y/y) gain in computers.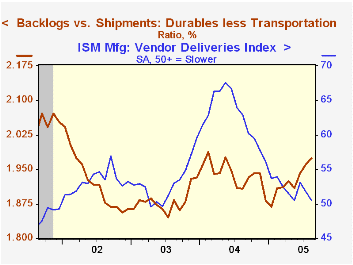
Orders for fabricated metals products rose 4.6% (3.1% y/y) to a record high while primary metal orders surged 9.2% (2.5% y/y), also a record.
Shipments of durable goods rose 1.7% (4.3% y/y) in August but less transportation shipments rose a stronger 1.2% (5.4% y/y).
Order backlogs surged 1.7%(10.3% y/y). Backlogs excluding transportation also were firm and rose 1.9% (9.1% y/y) due to broad based strength. The ratio of backlogs to shipments excluding transportation rose to the highest since last year.
Durable inventories fell 0.2% (+5.6% y/y) following an upwardly revised 0.8% rise in July.
Chairman Greenspan's comments to the National Association for Business Economists titled Economic Flexibility can be found here.
| NAICS Classification | Aug | July | Y/Y | 2004 | 2003 | 2002 |
|---|---|---|---|---|---|---|
| Durable Goods Orders | 3.3% | -5.3% | 7.9% | 9.5% | 4.1% | -3.4% |
| Excluding Transportation | 4.2% | -3.7% | 7.5% | 11.7% | 3.1% | -6.2% |
| Nondefense Capital Goods | 4.3% | -7.1% | 21.2% | 11.0% | 4.2% | -9.8% |
| Excluding Aircraft | 3.6% | -3.3% | 12.4% | 9.5% | 4.8% | -10.5% |
by Tom Moeller September 28, 2005
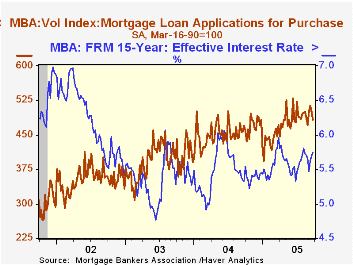
The total number of mortgage applications fell a sharp 6.6% last week, according to the Mortgage Bankers Association, and left applications so far in September 1.4% above August.
Mortgage applications to refinance plummeted 10.5% w/w and for the month are a slight 0.6% above August which fell 10.6% from July.
Purchase applications fell hard for the second consecutive week. The 3.4% decline lowered the gain in September to 2.0% versus August. During the last ten years there has been a 49% correlation between the y/y change in purchase applications and the change in new plus existing single family home sales.
The effective interest rate on a conventional 30-year mortgage rose slightly to 6.09% and the effective rate on a 15-year mortgage rose to 5.75%. The interest rate on 15 and 30 year mortgages are closely correlated (>90%) with the rate on 10 year Treasury securities.
The Mortgage Bankers Association surveys between 20 to 35 of the top lenders in the U.S. housing industry to derive its refinance, purchase and market indexes. The weekly survey accounts for more than 40% of all applications processed each week by mortgage lenders. Visit the Mortgage Bankers Association site here.
| MBA Mortgage Applications (3/16/90=100) | 09/23/05 | 09/16/05 | Y/Y | 2004 | 2003 | 2002 |
|---|---|---|---|---|---|---|
| Total Market Index | 721.2 | 772.2 | -0.5% | 735.1 | 1,067.9 | 799.7 |
| Purchase | 483.1 | 500.3 | 3.0% | 454.5 | 395.1 | 354.7 |
| Refinancing | 2,106.6 | 2,353.7 | -4.7% | 2,366.8 | 4,981.8 | 3,388.0 |
by Carol Stone September 28, 2005
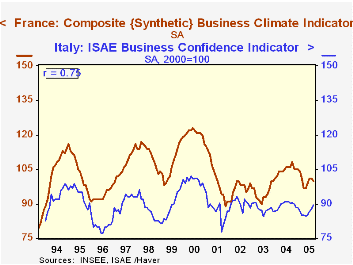
Business surveys for four European countries reported today for September and August show a largely stagnant picture for European companies. Signs of life that had appeared earlier seem to have dissipated.
In France, for example, the INSEE synthetic climate indicator (a composite of current and expected production and order trends) sits at 100, an absolutely neutral result. Last year, it averaged 104 and reached a peak of 108 in October, but this modest optimism was not sustained. The best it seems possible to glean about French industry is that some slight weakness this past spring -- an average of 98 in Q2 -- was also not long-lasting.
Italy's ISAE business confidence indicator rose in September to 89.5 from 87.8 in August (index, 2000=100). As can be seen in the first graph, the index has oscillated in a narrow range for sometime, and this latest increase only maintains the recent average. Since the beginning of 2002, the indicator has averaged 88.6, and the average for August and September is 88.7. Such unexciting movement is also evident in Italian factories' order books, which have a negative balance of 12 for this month, better than the prior couple of months, but no firmer than the same period a year ago.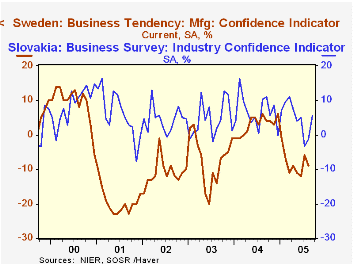
Sweden's manufacturers also were looking better in 2004, but have retreated since. Their overall confidence indicator moved into positive territory temporarily, but right at the turn of 2005, it dropped back once again. This is reflected in the pattern of orders received, which were quite vigorous last year, reaching +28 in August 2004, but then sagging into single digits in recent months. In Slovakia, business confidence gained for September, but the most significant fact about its movement is how much it swings up and down from month to month, so the latest increase is hardly a suggestion of genuine improvement. In fact, a broader measure of "economic sentiment", which includes consumers, declined, as did managers' perceptions of their order books.
In looking at European data, we keep coming back to energy cost as one reason for the unsatisfying performance of European business. For a time, the strengthening euro shielded most countries from a heavy burden of rising energy, which is priced in US dollars. But this pattern has been broken, and now oil is rising sharply in euro terms as well as dollars, making a greater drag on European manufacturers. Other commentators speak of regulatory rigidities in Europe, and this too limits the ability of manufacturers to respond quickly to changing circumstances, probably also accounting for the lackluster trend in business sentiment.
| European Business Surveys: +/- balance, except where noted | Sept 2005 | Aug 2005 | July 2005 | Year Ago | 2004 | 2003 | 2002 |
|---|---|---|---|---|---|---|---|
| France: Climate Indicator (100=neutral) | 100 | 101 | 101 | 106 | 105 | 95 | 97 |
| Manufacturers' Order Books | -18 | -17 | -15 | -10 | -14 | -26 | -22 |
| Italy: ISAE Business Confidence (2000=100) | 89.5 | 87.8 | 86.5 | 90.2 | 89.5 | 87.9 | 90.1 |
| Manufacturers' Order Books | -12 | -16 | -19 | -12 | -15 | -21 | -16 |
| Sweden: Manufacturing Confidence Indicator | -- | -9 | -6 | +6 | +3 | -7 | -11 |
| Orders Received | -- | +10 | +4 | +28 | +21 | +4 | -1 |
| Slovakia: Industry Confidence | +5.7 | -1.3 | -3.3 | +11.0 | +6.8 | +4.6 | +4.6 |

Tom Moeller
AuthorMore in Author Profile »Prior to joining Haver Analytics in 2000, Mr. Moeller worked as the Economist at Chancellor Capital Management from 1985 to 1999. There, he developed comprehensive economic forecasts and interpreted economic data for equity and fixed income portfolio managers. Also at Chancellor, Mr. Moeller worked as an equity analyst and was responsible for researching and rating companies in the economically sensitive automobile and housing industries for investment in Chancellor’s equity portfolio. Prior to joining Chancellor, Mr. Moeller was an Economist at Citibank from 1979 to 1984. He also analyzed pricing behavior in the metals industry for the Council on Wage and Price Stability in Washington, D.C. In 1999, Mr. Moeller received the award for most accurate forecast from the Forecasters' Club of New York. From 1990 to 1992 he was President of the New York Association for Business Economists. Mr. Moeller earned an M.B.A. in Finance from Fordham University, where he graduated in 1987. He holds a Bachelor of Arts in Economics from George Washington University.
More Economy in Brief


