 Global| May 25 2005
U.S. Durable Goods Orders Rebounded
by:Tom Moeller
|in:Economy in Brief
Summary
New orders for durable goods rebounded 1.9% in April following three consecutive months of decline. Consensus expectations had been for a 1.2% rise. Year to date orders are down 1.1%. An 8.2% jump in orders for transportation [...]
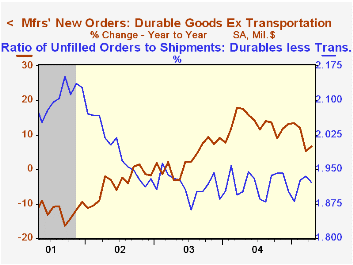
New orders for durable goods rebounded 1.9% in April following three consecutive months of decline. Consensus expectations had been for a 1.2% rise. Year to date orders are down 1.1%.
An 8.2% jump in orders for transportation equipment pulled the April total up and reflected a 28.2% (18.5% y/y) rise in nondefense aircraft & parts as well as a 3.4% (-5.0% y/y) gain in motor vehicles & parts. Less transportation durable orders fell 0.2% (+6.8% y/y), marking the third month of roughly sideways movement.
With a 3.8% jump, orders for non-defense capital goods recovered all of the prior month's decline. A 1.6% gain in orders less aircraft also recovered most of March's drop but that decline was lessened considerably. Computer & electronic product orders fell 5.8% (+6.8% y/y) following a 4.7% jump in March that was double the gain initially estimated. Machinery orders rose 2.2% and recovered nearly half the prior month's drop while electrical equipment orders rose 3.4% after two months of sharp decline.
Shipments of durables rose 1.6% (6.4% y/y). Orders outside of transportation increased 1.0% (8.3% y/y) due to a 1.5% (9.3% y/y) increase in machinery shipments and a 1.9% jump (5.2% y/y) in electrical equipment.
Durable inventories ticked just 0.1% (9.2% y/y) higher causing the I/S ratio to drop sharply. Less transportation the I/S ratio has moved sideways in a narrow range since early last year.
Unfilled orders were roughly unchanged (+6.2% y/y). The ratio of backlogs to shipments fell sharply to the low end of the year's range.
| NAICS Classification | April | March | Y/Y | 2004 | 2003 | 2002 |
|---|---|---|---|---|---|---|
| Durable Goods Orders | 1.9% | -1.6% | 4.3% | 10.8% | 2.6% | -1.7% |
| Nondefense Capital Goods | 3.8% | -3.2% | 10.1% | 13.7% | 5.6% | -7.2% |
| Excluding Aircraft | 1.6% | -1.6% | 9.3% | 11.7% | 6.6% | -7.1% |
by Tom Moeller May 25, 2005
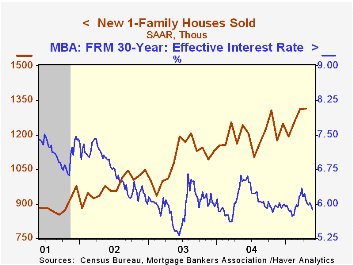
New single-family home sales in April rose just 0.2% m/m to 1.316M and the prior month's increase was more than halved. Nevertheless, sales in April set a record and for the year to date are 5.8% ahead of the 2004 average. Consensus estimates had been for sales of 1.325M.
Sales in the Northeast last month spurted by more than one third (28.9% y/y). In the West sales rose moderately (6.4% y/y) but in the Midwest sales fell for the third month this year (+1.0% Y/Y). In the South sales also fell by 5.3% (+20.2% y/y).
The median price of a new single family home recovered most of the prior month's decline and rose 6.1% to $230,800 (3.8% y/y).
The figures from the Census Department reflect homes sold.
The latest FOMC meeting minutes can be found here.
| Homes Sales (000s, AR) | April | March | Y/Y | 2004 | 2003 | 2002 |
|---|---|---|---|---|---|---|
| New Single-Family | 1,316 | 1,313 | 13.3% | 1,200 | 1,091 | 976 |
by Tom Moeller May 25, 2005
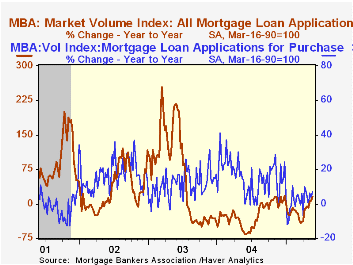
Last week total mortgage applications recovered nearly half of the prior period's decline with a 4.3% gain that left applications so far in May 7.4% ahead of the April average, according to the Mortgage Bankers Association.
The gain was led by a 6.4% rise in applications to refinance which are 11.3% higher than in April.
Applications to purchase a home rose 2.8% following the prior week's 10.8% slump, yet in May are 4.7% ahead of April. During the last ten years there has been a 50% correlation between the y/y change in purchase applications and the change in new plus existing single family home sales.
The effective interest rate on a conventional 30-year mortgage fell to 5.88%, the lowest level since mid February. The effective rate on a 15-year mortgage fell to 5.53%.
The Mortgage Bankers Association surveys between 20 to 35 of the top lenders in the U.S. housing industry to derive its refinance, purchase and market indexes. The weekly survey accounts for more than 40% of all applications processed each week by mortgage lenders. Visit the Mortgage Bankers Association site here.
| MBA Mortgage Applications (3/16/90=100) | 05/20/05 | 05/13/05 | Y/Y | 2004 | 2003 | 2002 |
|---|---|---|---|---|---|---|
| Total Market Index | 729.6 | 699.2 | 15.4% | 735.1 | 1,067.9 | 799.7 |
| Purchase | 482.3 | 469.3 | 7.2% | 454.5 | 395.1 | 354.7 |
| Refinancing | 2,167.9 | 2,036.7 | 27.9% | 2,366.8 | 4,981.8 | 3,388.0 |
by Carol Stone May 25, 2005

GDP in Spain grew 0.9% in Q1, the same as in Q4, according to the quarterly data released this morning by the National Statistics Institute. Boosts to the quarter's performance came from government consumption, up 2.6%, and a drop in imports of 1.6%. Household consumption grew 0.6%, slower than in Q4, and capital formation also expanded more slowly. Exports decreased 1.7%, their second successive decline, pulling them down 2.5% compared to a year ago. However, an accompanying decrease in imports stabilized the real net export balance with the Q4 amount.
In today's report, Spain has switched to chain-linking for calculating quarterly real growth and inflation; the reference year for these calculations is 2000. The data previously used fixed 1995 weights. [Some annual data on the new basis were reported last week.] As seen in the graph and in the table below, growth is consistently higher in the new figures. In 2002 and 2003 this resulted from stronger gains in fixed investment, but through the last year or so, household consumption has been much more vigorous than under the former calculation scheme.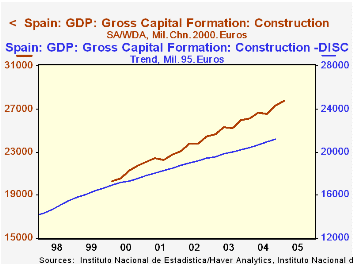
In the US experience, chain-weighting has a different impact: it tends to reduce total growth and, in particular, that of investment expenditures. It dilutes the effect of heavier buying of equipment, for which prices are falling. But in Spain, the reported volume of investment spending has been raised, perhaps because of the sizable role of construction in the Spanish economy. Construction is a considerably larger share of nominal GDP, 16.7% in Q1, than in the US, 10.2%. Construction prices have increased relative to total GDP, so that item has generally benefited from the chain-weighting process. Its greater weight in turn gives more lift to the total chain-weighted GDP result.
| Q1 2005 | Q4 2004 | Q3 2004 | Year/ Year | 2004 | 2003 | 2002 | |
|---|---|---|---|---|---|---|---|
| GDP - 2000 Prices | 0.9 | 0.9 | 0.7 | 3.1 | 3.1 | 2.9 | 2.7 |
| Memo: GDP - 1995 Prices | -- | 0.8 | 0.6 | 2.7 | 2.5 | 2.2 | |
| Household Consumption | 0.6 | 1.7 | 1.4 | 4.6 | 4.4 | 2.5 | 2.8 |
| Gross Fixed Capital Formation | 0.9 | 3.4 | 2.2 | 6.5 | 4.4 | 5.3 | 3.3 |
| Exports | -1.7 | -0.8 | 1.4 | -2.5 | 2.8 | 3.6 | 1.8 |
| Imports | -1.6 | 1.6 | 3.5 | 5.5 | 8.1 | 6.3 | 3.8 |

Tom Moeller
AuthorMore in Author Profile »Prior to joining Haver Analytics in 2000, Mr. Moeller worked as the Economist at Chancellor Capital Management from 1985 to 1999. There, he developed comprehensive economic forecasts and interpreted economic data for equity and fixed income portfolio managers. Also at Chancellor, Mr. Moeller worked as an equity analyst and was responsible for researching and rating companies in the economically sensitive automobile and housing industries for investment in Chancellor’s equity portfolio. Prior to joining Chancellor, Mr. Moeller was an Economist at Citibank from 1979 to 1984. He also analyzed pricing behavior in the metals industry for the Council on Wage and Price Stability in Washington, D.C. In 1999, Mr. Moeller received the award for most accurate forecast from the Forecasters' Club of New York. From 1990 to 1992 he was President of the New York Association for Business Economists. Mr. Moeller earned an M.B.A. in Finance from Fordham University, where he graduated in 1987. He holds a Bachelor of Arts in Economics from George Washington University.
More Economy in Brief


