 Global| Mar 26 2008
U.S. Durable Goods Orders Post Surprising Decline
by:Tom Moeller
|in:Economy in Brief
Summary
New orders for durable manufactured goods fell 1.7% last month. During January orders declined 4.7% and that was slightly less severe than originally reported. Consensus expectations had been for a slight uptick in February orders. [...]
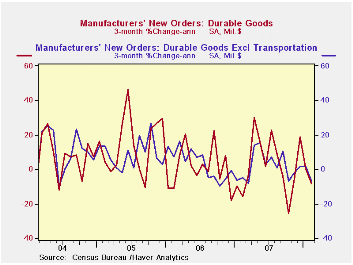
New orders for durable manufactured goods fell 1.7% last month. During January orders declined 4.7% and that was slightly less severe than originally reported. Consensus expectations had been for a slight uptick in February orders. Weakness in factory orders initially was suggested by the Institute for Supply Management's orders index which at 49.1 in February remained below the breakeven level of 50.
Excluding the volatile transportation sector, durable goods
orders fell 2.6% after a 1.0% January decline that was slightly
shallower than initially estimated.
Orders for transportation equipment rose a modest 0.6% after the 12.8% January slump. New orders for aircraft & parts recovered 5.1% (22.8% y/y) after a 30.7% January collapse but orders for motor vehicles parts fell 2.7% (-7.7% y/y). Orders for nondefense aircraft rose 5.4% following a 30.3% January drop.
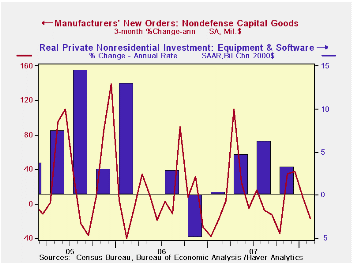
Despite the rise in aircraft orders, orders for nondefense capital goods fell 1.0% after a little revised 8.4% January swoon . During the last ten years there has been an 80% correlation between the y/y gain in nondefense capital goods orders and the rise in equipment & software spending in the GDP accounts. The correlation with capital goods shipments is, as one would expect, a larger 92%.
February orders for nondefense capital goods less aircraft fell 2.6% following a 1.8% January decline that was deeper than initially estimated.
Orders for machinery fell a hard 13.3% (+0.7% y/y) following a modest 0.4% January uptick.Computers & related products orders, however, made up most of the prior month's decline with a 10.0% increase. Orders for communications equipment also recovered but only by 6.0% after a 14.1% January drop. Primary metal orders rose 1.0% and essentially repeated a 0.9% January increase.
Overall shipments of durable goods gave back all of the January increase with a 2.8% decline last month. That was led by a 4.1% drop in shipments from the transportation sector. Less transportation, shipments were weak and fell 2.3% (+3.1% y/y).
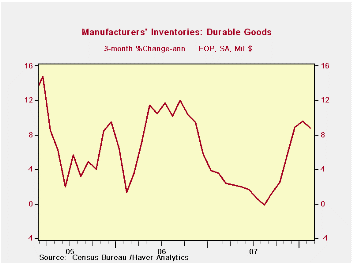
Inventories of durable goods rose 0.5% (4.1% y/y) and they have been building at an accelerated rate during the last few months. Annualized, an 8.8% rate of accumulation during those three months is up from -0.1% last August. Less transportation, inventories rose at a 4.7% rate during the last three months and that was raised from -0.6% last Summer.
| NAICS Classification | February | January | Y/Y | 2007 | 2006 | 2005 |
|---|---|---|---|---|---|---|
| Durable Goods Orders | -1.7% | -4.7% | 2.2% | 0.9% | 6.3% | 9.9% |
| Excluding Transportation | -2.6% | -1.0% | 1.6% | 0.2% | 7.6% | 8.8% |
| Nondefense Capital Goods | -1.0% | -8.4% | 6.9% | 3.5% | 10.6% | 17.1% |
| Excluding Aircraft | -2.6% | -1.8% | 4.7% | -1.6% | 8.5% | 11.1% |
by Tom Moeller March 26, 2008
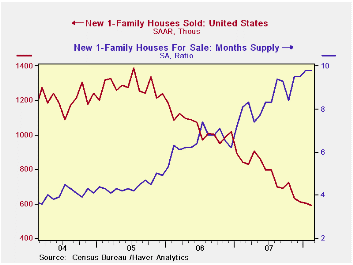
New single family home sales fell 1.8% during February to 590,000 after a 1.6% January decline that was slightly less than reported initially. The decline dropped sales to the lowest level since 1995 and they were down 57.5% since the peak in July of 2005. A sales rate of 576,000 was the Consensus expectation for sales last month.
By region, sales in the Northeast were by far the weakest last
month and dropped 40.3% (-19.6% y/y). Sales in the Midwest also
continued quite weak and fell 6.4% during February (-42.5% y/y).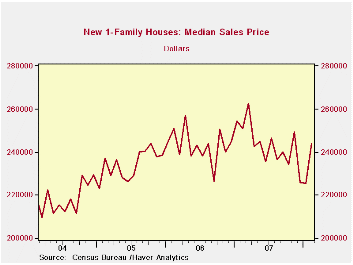
In the West sales added a slight 0.7% (-28.3% y/y) to the 5.0% January increase while sales in the South recovered all of the January decline and rose 5.7% (-27.9% y/y).
The median price for a new single family home rose a firm 8.2% to $244,100 after a 0.2% January downtick. Prices were down 7.0% from the early 2007 peak. That was much less of a decline point to point reported last month due to the February rise and upward revisions.
The number of new homes for sale fell 2.1% last month, continuing a recent decline. Since the July '06 peak the number of new homes on the market was down 17.8%.
Continuing the recent trend, the decline in the inventory of homes for sale did not keep pace with the weakness in home sales. At the current low sales rate, the 9.8 months' supply of homes on the market was more than double the rate for all of 2005 and it was the highest since 1981.
Falling House Prices and Rising Time on the Market from the Federal Reserve Bank of San Francisco can be found here.
| US New Homes | February | January | Y/Y | 2007 | 2006 | 2005 |
|---|---|---|---|---|---|---|
| Total Sales (SAAR, 000s) | 590 | 601 | -29.8% | 774 | 1,049 | 1,279 |
| Median Price (NSA, $) | 244,100 | 225,600 | -2.7% | 243,500 | 243,067 | 234,208 |
by Robert Brusca March 26, 2008
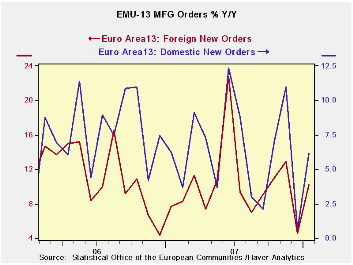
It may not be resiliency as much as volatility as the rise in January EMU orders still shows growth rates steadily declining from 12 months to 6 months to 3 months. In the current quarter despite the bump up in January orders are only rising at a 1.2% annual rate over Q4. Still, other more ‘timely’ data tell a better resiliency story.
Total domestic orders show the same steady deceleration in orders as overall orders with the recent three-month order growth rate at a -3.7$ saar. Foreign MFG orders do not show the clear slowdown of overall orders, but that is a bit of nitpicking since the 6-month growth rate is about the same as the 12-month pace and the recent 3-month growth rate is about half of those rates at 5.5%. The Euro Area does seem to be slowing domestically and, despite the strength of the euro, foreign growth is keeping the EMU stronger.
Germany and Italy show withering order trends. France is consistent with a slowdown. Only the UK is different on a jump in orders in January that has sent the three-month growth rate soaring.
On balance though, the ECB and EU Commission seem still very worried about the level of the euro. But the German IFO index has risen again in March and the new Belgian Bank index for March also has shown growth for the second month running. This domestic resilience was not expected.
Data and Policy Conundrums… The
orders data tell us that domestic orders are in a slowing pattern. The
strength has come from orders outside the EMU. Now some new measures
are showing that there may be some domestic resiliency in February and
March in Germany and Belgium. None of this will make the ECB ready to
reverse its course and cut rates anytime soon. It makes you wonder if
the euro really does have more upside, something I have been unwilling
to ponder up to now. Is
Europe swallowing its teeth to hide the euro’s damage to its economy?
Or is Europe really this resilient? If Europe is this resilient, the
ECB’s carping about inflation risk makes sense, but complaining about
‘euro strength and excessive FX volatility’ does not make sense. Which
is it?
| Euro Area and UK Industrial Orders & Sales Trends | |||||||||
|---|---|---|---|---|---|---|---|---|---|
| SAAR except M/M | % m/m | Jan-08 | Jan-08 | Jan-08 | Jan-07 | Jan-06 | Qtr-2 Date |
||
| Euro Area Detail | Jan-08 | Dec-07 | Nov-07 | 3-Mo | 6-mo | 12-mo | 12-mo | 12-mo | Saar |
| MFG Orders | 2.0% | -3.6% | 2.0% | 1.2% | 3.6% | 6.7% | 7.7% | 6.7% | 1.2% |
| MFG Sales | 0.8% | 0.3% | 0.0% | 4.6% | 1.8% | 4.1% | 7.2% | 6.5% | 6.3% |
| Consumer | 0.3% | 0.3% | 0.2% | 3.1% | 2.9% | 3.4% | 7.2% | 6.5% | 3.3% |
| Capital | 0.4% | 0.1% | 0.0% | 1.6% | 2.4% | 4.6% | 4.7% | 3.4% | 2.4% |
| Intermediate | 1.1% | 0.5% | 0.2% | -3.7% | -0.4% | 6.2% | 8.4% | 6.0% | 9.2% |
| MFG Orders | |||||||||
| Total Orders | 2.0% | -3.6% | 2.0% | 1.2% | 3.6% | 6.7% | 7.7% | 6.7% | 1.2% |
| EA13 Domestic MFG orders | 1.6% | -4.3% | 1.8% | -3.7% | -0.4% | 6.2% | 6.2% | 1.6% | -4.2% |
| EA13 Foreign MFG orders | 3.3% | -5.4% | 3.7% | 5.5% | 11.3% | 10.2% | 7.8% | 11.2% | 4.7% |
| Countries: | Jan-08 | Dec-07 | Nov-07 | 3-Mo | 6-mo | 12-mo | 12-mo | 12-mo | Qtr-2 Date |
| Germany: | -1.1% | -1.5% | 3.5% | 3.5% | 9.4% | 9.3% | 9.2% | 8.6% | -5.5% |
| France: | 3.1% | -2.1% | -0.2% | 3.0% | -2.7% | 5.9% | 5.1% | 7.8% | 10.1% |
| Italy | 2.6% | -5.6% | 2.9% | -1.0% | -3.0% | 7.2% | 4.6% | 9.0% | -1.8% |
| UK (EU) | 23.0% | -1.3% | 4.0% | 154.7% | -4.6% | 31.1% | 10.1% | -8.8% | 255.9% |
by Robert Brusca March 26, 2008
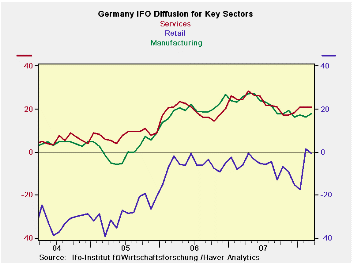
The IFO headline index rose to 104.08 in March from 103.1 in February. This rise marks the third straight increase from a low of 103 in December 2007. It comes at a time that the euro is moving relentlessly higher and policymakers are complaining about that. The quick rebound in the IFO index and apparent health it signals sires questions about the rest of Europe.
Germany’s current situation is improving for the second month in a row with the index up to 111.5 from 110.3 in February. Expectations also notched higher, rising for the second time in four months. Expectations are having a bit of a harder time of it. The expectations index edged higher to 98.4 in March from 98.2 in February
Germany’s sectors look fairy solid as the IFO diffusion gauges show in the table below. Construction is the weakest sector and it is in the 56th percentile of its range of values since 1991. Manufacturing is still the strongest sector in the 84th percentile of its range and services are strong in the 83rd percentile of their range. Wholesaling and retailing are in the mid 75th or so percentile of their respective ranges. This leaves Germany’s overall sector index in the 83rd percentile, hardly a weak showing.
If Germany is this resilient, is the rest of EMU going to have
more trouble? A strong Germany will tend to the keep the ECB tighter
longer. But Italian data have been decidedly weak with orders fading
and both consumer and business morale measures from ISAE on very weak
trends. EMU countries share a common currency but national inflation
rates have been quite different across EMU member countries ever since
the currency union was formed; it may be that competitiveness levels in
the EMUe are not on level playing field. That could cause a real
policy-making dilemma and worse political trouble within the union.
| Summary of IFO Sector Diffusion readings: CLIMATE | ||||||||
|---|---|---|---|---|---|---|---|---|
| Current | Last Month | Since Jan 1991* | ||||||
| Mar-08 | Feb-08 | Average | Median | Max | Min | range | % range | |
| All Sectors | 8.7 | 7.3 | -8.7 | -9.5 | 16.7 | -30.7 | 47.4 | 83.1% |
| MFG | 17.9 | 16.3 | -0.6 | 0.2 | 27.4 | -35.6 | 63.0 | 84.9% |
| Construction | -21.8 | -24.9 | -30.0 | -32.2 | 0.1 | -50.5 | 50.6 | 56.7% |
| Wholesale | 7.8 | 5.8 | -14.8 | -16.5 | 23.4 | -39.5 | 62.9 | 75.2% |
| Retail | -0.9 | 1.3 | -15.9 | -15.0 | 11.3 | -39.7 | 51.0 | 76.1% |
| Services | 21.0 | 21.0 | 9.5 | 8.9 | 28.5 | -15.7 | 44.2 | 83.0% |
| *May 2001 for Services | ||||||||
by Robert Brusca March 26, 2008

Italy’s Business confidence gauge from ISAE edged lower in March to 89 from 89.6 in February. The pace of its decline, however, seems to have slowed (see the blue line in accompanying chart). Overall confidence is not in terrible shape as it stands in the 72nd percentile of its range of values going back to 1991. But it has weakened and is weaker than it was.
Still, Italy shows the same malaise as most other European countries. It is the consumer sector that is weakest. The industry order gauge for consumer goods stands in the 15th percentile of its range, the weakest of all sectors. Intermediate goods orders are in the 43rd percentile of their range and capital goods orders are in the 57th percentile of their range. For all of industrial the sector order gauge stands in the 31st percentile of its range.
For most sectors domestic and foreign orders are about the same in percentile terms. But for consumer goods, foreign orders are in the 31st percentile of their range compared to a 13 percentile standing for domestic orders. The consumer goods production gauge is also the weakest among sectors standing in the 19th percentile compared to 51st percentile for capital goods and a 31st percentile reading for intermediate goods.
In Italy capital goods are holding up while the consumer
sector is under pressure led by weakness at home.
While Italy’s business gauge has continued to drop the
good news is that the pace of that drop has slowed.
| Italy ISAE Business Sentiment | ||||||||||
|---|---|---|---|---|---|---|---|---|---|---|
| Since January 1999 | ||||||||||
| Mar 08 |
Feb 08 |
Jan 08 |
Dec 07 |
%tile | Rank | Max | Min | Range | Mean | |
| Biz Confidence | 89 | 89.6 | 91.2 | 91.8 | 39.9 | 72 | 102 | 81 | 21 | 91 |
| TOTAL INDUSTRY | ||||||||||
| Order books & Demand | ||||||||||
| Total | -16 | -13 | -8 | -5 | 31.0 | 67 | 13 | -29 | 42 | -11 |
| Domestic | -16 | -16 | -15 | -9 | 35.7 | 61 | 11 | -31 | 42 | -13 |
| Foreign | -17 | -17 | -11 | -6 | 36.4 | 52 | 11 | -33 | 44 | -14 |
| Inventories | 3 | 5 | 5 | 6 | 58.3 | 80 | 13 | -11 | 24 | 4 |
| Production | -11 | -13 | -12 | -4 | 32.7 | 60 | 22 | -27 | 49 | -6 |
| INTERMEDIATE | ||||||||||
| Order books & Demand | ||||||||||
| Total | -17 | -14 | -13 | -13 | 34.5 | 66 | 19 | -36 | 55 | -12 |
| Domestic | -16 | -14 | -17 | -15 | 39.6 | 58 | 16 | -37 | 53 | -14 |
| Foreign | -19 | -21 | -13 | -13 | 37.3 | 65 | 18 | -41 | 59 | -13 |
| Inventories | 4 | 4 | 3 | 6 | 65.5 | 29 | 14 | -15 | 29 | 0 |
| Production | -13 | -13 | -14 | -11 | 31.0 | 63 | 27 | -31 | 58 | -8 |
| INVESTMENT GOODS | ||||||||||
| Order books & Demand | ||||||||||
| Total | 1 | -4 | 1 | 4 | 57.5 | 34 | 32 | -41 | 73 | -7 |
| Domestic | -6 | -8 | -5 | 0 | 54.4 | 34 | 25 | -43 | 68 | -12 |
| Foreign | 0 | -8 | -1 | 2 | 58.9 | 35 | 23 | -33 | 56 | -8 |
| Inventories | 0 | 6 | 4 | 3 | 45.9 | 62 | 20 | -17 | 37 | 2 |
| Production | 3 | -4 | -1 | 6 | 51.5 | 34 | 35 | -31 | 66 | -2 |
| CONSUMER GOODS | ||||||||||
| Order books & Demand | ||||||||||
| Total | -22 | -23 | -18 | -5 | 15.9 | 89 | 15 | -29 | 44 | -10 |
| Domestic | -23 | -24 | -21 | -8 | 13.9 | 89 | 8 | -28 | 36 | -12 |
| Foreign | -20 | -18 | -24 | -11 | 31.9 | 66 | 12 | -35 | 47 | -15 |
| Inventories | 3 | 6 | 6 | 5 | 53.8 | 66 | 15 | -11 | 26 | 3 |
| Production | -18 | -20 | -17 | -2 | 19.4 | 89 | 11 | -25 | 36 | -7 |
| Total number of months: 118 | ||||||||||

Tom Moeller
AuthorMore in Author Profile »Prior to joining Haver Analytics in 2000, Mr. Moeller worked as the Economist at Chancellor Capital Management from 1985 to 1999. There, he developed comprehensive economic forecasts and interpreted economic data for equity and fixed income portfolio managers. Also at Chancellor, Mr. Moeller worked as an equity analyst and was responsible for researching and rating companies in the economically sensitive automobile and housing industries for investment in Chancellor’s equity portfolio. Prior to joining Chancellor, Mr. Moeller was an Economist at Citibank from 1979 to 1984. He also analyzed pricing behavior in the metals industry for the Council on Wage and Price Stability in Washington, D.C. In 1999, Mr. Moeller received the award for most accurate forecast from the Forecasters' Club of New York. From 1990 to 1992 he was President of the New York Association for Business Economists. Mr. Moeller earned an M.B.A. in Finance from Fordham University, where he graduated in 1987. He holds a Bachelor of Arts in Economics from George Washington University.
More Economy in Brief


