 Global| Apr 27 2005
U.S. Durable Goods Orders Off Sharply
by:Tom Moeller
|in:Economy in Brief
Summary
Orders received by U.S. manufacturers of durable goods dropped 2.8% last month following a revised 0.2% dip in February. It was the third consecutive monthly decline in new orders. Consensus expectations had been for a 0.3% rise. [...]
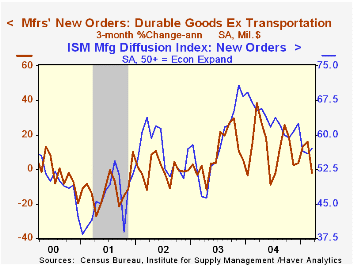
Orders received by U.S. manufacturers of durable goods dropped 2.8% last month following a revised 0.2% dip in February. It was the third consecutive monthly decline in new orders. Consensus expectations had been for a 0.3% rise.
Lower orders for transportation equipment, down 7.8% (-15.3% y/y), reflected steep declines in orders for both civilian (-22.7% m/m, -15.3% y/y) and defense (-35.0% m/m, -23.0% y/y) aircraft. The third consecutive decline motor vehicle & parts orders (-11.0% y/y) also contributed. Less transportation durable orders fell 1.0% (+3.9% y/y).
Orders for non-defense capital goods fell 6.2%. Less aircraft, the 4.7% decline reflected a 3.4% (+0.6% y/y) drop in orders for electrical equipment and a 7.6% drop in orders for machinery (+0.5% y/y). Computer & electronic product orders rose 2.2% (7.9% y/y).
Shipments of durables slipped 0.2% (+3.5% y/y) while durable inventories rose 0.4% (9.6% y/y). That rise caused the I/S ratio to increase to its highest level since late 2003.
Unfilled orders fell 0.5% (+6.6% y/y) and the ratio of backlogs to shipments gave back some of prior month's sharp increase.
| NAICS Classification | Mar | Feb | Y/Y | 2004 | 2003 | 2002 |
|---|---|---|---|---|---|---|
| Durable Goods Orders | -2.8% | -0.2% | -1.7% | 10.8% | 2.6% | -1.7% |
| Nondefense Capital Goods | -6.2% | -0.7% | 1.1% | 13.7% | 5.6% | -7.2% |
| Excluding Aircraft | -4.7% | -2.5% | 1.6% | 11.7% | 6.6% | -7.1% |
by Tom Moeller April 27, 2005
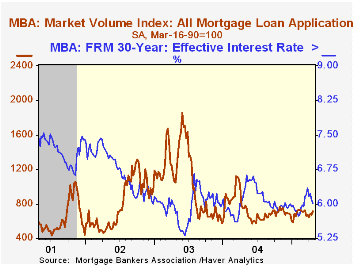
The Mortgage Bankers Association reported that mortgage applications increased 5.9% last week to the highest level in six weeks. Nevertheless, the average level so far in April remained below March.
Applications to refinance rose 9.8% yet the April average still is off 7.0% from March.
Purchase applications rose 3.3% and the average in April is 2.0% ahead of March which rose 6.1% from February. During the last ten years there has been a 50% correlation between the y/y change in purchase applications and the change in new plus existing single family home sales.
The effective interest rate on a conventional 30-year mortgage fell to 6.01% from 6.08%, the lowest level since early March. The effective rate on a 15-year mortgage also fell to 5.65%.
The Mortgage Bankers Association surveys between 20 to 35 of the top lenders in the U.S. housing industry to derive its refinance, purchase and market indexes. The weekly survey accounts for more than 40% of all applications processed each week by mortgage lenders. Visit the Mortgage Bankers Association site here.
| MBA Mortgage Applications (3/16/90=100) | 04/22/05 | 04/15/05 | Y/Y | 2004 | 2003 | 2002 |
|---|---|---|---|---|---|---|
| Total Market Index | 712.4 | 672.6 | -4.8% | 735.1 | 1,067.9 | 799.7 |
| Purchase | 482.0 | 466.7 | 4.0% | 454.5 | 395.1 | 354.7 |
| Refinancing | 2,052.5 | 1,870.0 | -14.6% | 2,366.8 | 4,981.8 | 3,388.0 |
by Carol Stone April 27, 2005
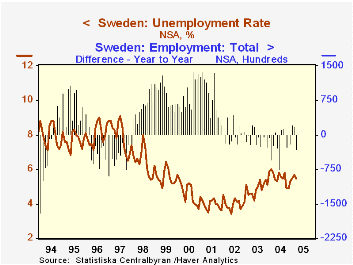
The Swedish labor market gives some signs of firming up in the March/Q1 report issued today by Statistics Sweden. The unemployment rate stands at 5.5%, lower by 0.3 percentage point than March 2004. Total employment is still decreasing, but quarterly data indicate a stabilizing trend, with the Q1 average 4,145,700 virtually identical to Q1 2004. The quarterly data for employment by industry also reveal that non-manufacturing jobs have started to increase, however slightly.
At the same time, the "improvement" in the unemployment situation is partially related to reduced labor force participation. As shown in the table below, a participation rate which we calculate is off noticeably from last year to 76.2% from 77.4%, reflecting a sizable rise in the number of people not in the labor force. This movement reflects some month-to-month volatility, so it probably does not imply such a severe weakening of sentiment among labor market participants. In fact, consumer confidence has firmed considerably in recent months and averaged 11.5% in Q1, the highest quarterly average since Q4 2000. If people were so concerned about labor market prospects that they were pulling out of the labor force, confidence surveys would likely give some corroborating evidence of such distress.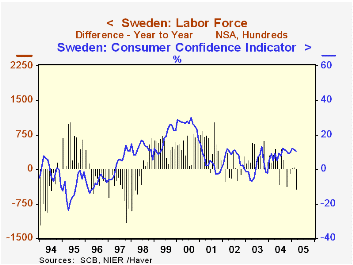
So labor market conditions are not particularly favorable in Sweden presently, but they do seem to be stabilizing after a protracted erosion from late 2001 to early last year.
| Sweden (Not Seasonally Adjusted) |
Mar 2005 | Feb 2005 | Year Ago | 2004 | 2003 | 2002 |
|---|---|---|---|---|---|---|
| Unemployment Rate (%) | 5.5 | 5.7 | 5.8 | 5.5 | 4.9 | 4.0 |
| Participation Rate (%)* | 76.2 | 76.2 | 77.4 | 77.8 | 78.0 | 78.0 |
| Employment (thous) | 4,148 | 4,132 | 4,178 | 4,213 | 4,232 | 4,242 |
| Manufacturing (thous) | Q1 2005 | Q1 2004 | 712 | 723 | 745 | |
| 694 | 703 | |||||
| Non-Manufacturing (thous) | 3,451 | 3,443 | 3,502 | 3,510 | 3,497 |

Tom Moeller
AuthorMore in Author Profile »Prior to joining Haver Analytics in 2000, Mr. Moeller worked as the Economist at Chancellor Capital Management from 1985 to 1999. There, he developed comprehensive economic forecasts and interpreted economic data for equity and fixed income portfolio managers. Also at Chancellor, Mr. Moeller worked as an equity analyst and was responsible for researching and rating companies in the economically sensitive automobile and housing industries for investment in Chancellor’s equity portfolio. Prior to joining Chancellor, Mr. Moeller was an Economist at Citibank from 1979 to 1984. He also analyzed pricing behavior in the metals industry for the Council on Wage and Price Stability in Washington, D.C. In 1999, Mr. Moeller received the award for most accurate forecast from the Forecasters' Club of New York. From 1990 to 1992 he was President of the New York Association for Business Economists. Mr. Moeller earned an M.B.A. in Finance from Fordham University, where he graduated in 1987. He holds a Bachelor of Arts in Economics from George Washington University.
More Economy in Brief


