 Global| Oct 27 2005
U.S. Durable Goods Orders Off
by:Tom Moeller
|in:Economy in Brief
Summary
A 41.6% m/m decline in nondefense aircraft orders combined with a 3.5% drop in defense aircraft bookings to pull total orders for durable goods down 2.1% last month. The 3.8% rise in August orders was upwardly revised and Consensus [...]

A 41.6% m/m decline in nondefense aircraft orders combined with a 3.5% drop in defense aircraft bookings to pull total orders for durable goods down 2.1% last month. The 3.8% rise in August orders was upwardly revised and Consensus expectations had been for a 1.2% September decline. 
Less the transportation sector altogether, durable goods orders slipped 1.0% after an upwardly revised 5.1% September jump, however, the year to year gain in orders less transportation is the same 6.0% as the gain in the total.
Total nondefense capital goods orders dropped 8.1% m/m due to the drop in aircraft but less aircraft these orders slipped a modest 1.2% following an upwardly revised 4.0% August surge.
Machinery orders increased 1.0% (7.6% y/y) on top of a 4.0% August gain and though electrical equipment orders fell 3.5% (8.4% y/y). Orders for computers & electronic products, down 3.6% (+0.9% y/y), fell hard for the second month in the last three. Computer orders fell 6.8% (+5.8% y/y).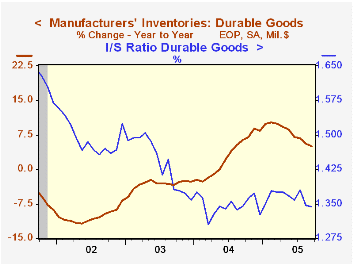
Shipments of durable goods edged up 0.1% (5.3% y/y) in September and less transportation shipments rose 0.4% (6.3% y/y).
Order backlogs rose another 0.7% (10.4% y/y) and excluding transportation backlogs jumped 1.1% (8.9% y/y). The ratio of backlogs to shipments excluding transportation rose to the highest since early 2004.
Durable inventories fell 0.1% (+5.1% y/y) following a 0.2% August decline. The momentum behind durable inventory accumulation has waned sharply to the point where the y/y gain is now half what it was earlier this year. As a result the I/S ratio for durable goods has fallen for most of this year.
| NAICS Classification | Sept | Aug | Y/Y | 2004 | 2003 | 2002 |
|---|---|---|---|---|---|---|
| Durable Goods Orders | -2.1% | 3.8% | 6.0% | 9.5% | 4.1% | -3.4% |
| Excluding Transportation | -1.0% | 5.1% | 6.0% | 11.7% | 3.1% | -6.2% |
| Nondefense Capital Goods | -8.1% | 4.1% | 8.5% | 11.0% | 4.2% | -9.8% |
| Excluding Aircraft | -1.2% | 4.0% | 5.4% | 9.5% | 4.8% | -10.5% |
by Tom Moeller October 27, 2005
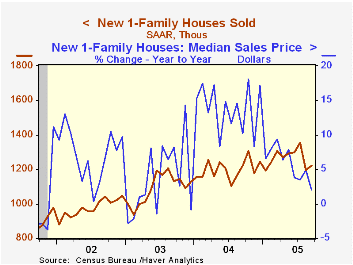
New single-family home sales edged up 2.1% last month to 1.222M but that followed an 11.6% drop in August which was deeper than estimated initially. Consensus expectations had been for 1.25M sales in September.
Sales fell a sharp 11.8% (-16.2% y/y) in the Northeast, down hard for the fourth month in the last five and sales are 43.4% below the April peak. In the West sales also fell by 11.8% (-16.2% y/y). Sales in the Midwest bucked the trend and rose 24.9% (0.4% y/y) while sales in the South also rose 5.6% (14.1% y/y).
The median price of a new single family home fell 5.7% m/m (+1.9% y/y) after an upwardly revised 4.1% August gain.
The figures from the Census Department reflect home sales counted at the time of sales contract or deposit.
| Homes Sales (000s, AR) | Sept | Aug | Y/Y | 2004 | 2003 | 2002 |
|---|---|---|---|---|---|---|
| New Single-Family | 1,222 | 1,197 | -0.1% | 1,200 | 1,091 | 976 |
by Tom Moeller October 27, 2005
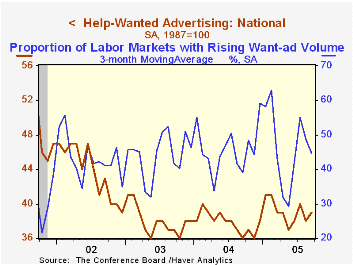
The Index of Help-Wanted Advertising from the Conference Board edged up in September to 39 from 38 in August which was upwardly revised.
During the last ten years there has been a 61% correlation between the level of help-wanted advertising and the three month change in non-farm payrolls.
The proportion of labor markets with rising want-ad volume rose to 39% from 22% in August.
The Conference Board surveys help-wanted advertising volume in 51 major newspapers across the country every month.
The latest help wanted report from the Conference Board is available here.
| Conference Board | Sept | Aug | Sept '04 |
|---|---|---|---|
| National Help Wanted Index | 39 | 38 | 36 |
by Tom Moeller October 27, 2005
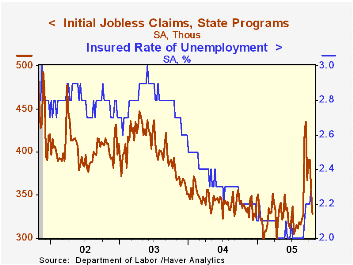
Initial claims for unemployment insurance fell 28,000 to 328,000 last week versus a little revised 35,000 decline during the prior period. Consensus expectations had been for 340,000 claims.
The four-week moving average of initial claims fell to 366,500 (+7.8% y/y).
Continuing claims for unemployment insurance rose 42,000 following a downwardly revised 4,000 gain during the prior week.
The insured rate of unemployment rose to 2.3% from 2.2% during the prior four weeks. The low in early September was 2.0%.
| Unemployment Insurance (000s) | 10/22/05 | 10/15/05 | Y/Y | 2004 | 2003 | 2002 |
|---|---|---|---|---|---|---|
| Initial Claims | 328 | 356 | -3.5% | 343 | 402 | 404 |
| Hurricane Related Claims (000, NSA) | 40 | 75 | ||||
| Continuing Claims | -- | 2,904 | 3.2% | 2,926 | 3,531 | 3,570 |
by Carol Stone October 27, 2005

The mortgage market in the UK picked up some steam once again in September, according to data reported this morning by the British Bankers' Association (BBA). The number of new mortgage loans approved for home purchase was 70,105, up 17% from the amount in September 2004. Loans for refinancing -- known as remortgaging in the UK -- were 72,485, up 3.2% from a year ago and the largest number since March 2004.
These BBA data cover "major British banking groups", a subset of all UK mortgage lenders accounting for about 70% of total volume. Complete data on new and outstanding mortgages will be reported Monday, October 31 by the Bank of England. But the BBA figures are a good indicator of the overall direction and magnitude of this activity. As seen in the first chart, this activity has picked up dramatically in recent years, giving this sector added attention in the markets. Indeed, this data set was added to Haver's UK database some months ago in response to British clients' requests for more extensive mortgage market coverage. We also carry the corresponding BOE tables and the Council of Mortgage Lenders' monthly survey.
As with mortgage lending in the US, the UK market is quite interest-rate sensitive -- perhaps even more so, since mortgage loans are generally shorter than those in the US. The key BOE base rate shows an 89% correlation with the net change in mortgage loans outstanding since 1995. This rate was at its recent lows in 2003 and mortgage lending was strong. As rates rose from late 2003 through the middle of 2004, lending slowed; the number of loan approvals fell steeply for both purchase and refinancing. Subsequently, and especially after the BOE's rate cut in August, the number of approvals and the net change in loans outstanding have picked up once again.
| United Kingdom: BBA Mortgage Lending Data |
Sept 2005 | Aug 2005 | Sept 2004 | Monthly Average|||
|---|---|---|---|---|---|---|
| 2004 | 2003 | 2002 | ||||
| Loans Approved: House Purchase (Number) |
70,105 | 69,499 | 59,905 | 69,231 | 76,105 | 83,915 |
| Loans Approved: Remortgaging (Number) |
72,485 | 69,145 | 70,209 | 68,299 | 77,482 | 67,108 |
| Net Change in Mortgage Loans Outstanding (SA, Bil.£) | 4.899 | 4.393 | 4.407 | 5.094 | 5.184 | 4.707 |
| Bank of England Base Rate | 4.50% | 4.53% | 4.75% | 4.38% | 3.69% | 4.00% |

Tom Moeller
AuthorMore in Author Profile »Prior to joining Haver Analytics in 2000, Mr. Moeller worked as the Economist at Chancellor Capital Management from 1985 to 1999. There, he developed comprehensive economic forecasts and interpreted economic data for equity and fixed income portfolio managers. Also at Chancellor, Mr. Moeller worked as an equity analyst and was responsible for researching and rating companies in the economically sensitive automobile and housing industries for investment in Chancellor’s equity portfolio. Prior to joining Chancellor, Mr. Moeller was an Economist at Citibank from 1979 to 1984. He also analyzed pricing behavior in the metals industry for the Council on Wage and Price Stability in Washington, D.C. In 1999, Mr. Moeller received the award for most accurate forecast from the Forecasters' Club of New York. From 1990 to 1992 he was President of the New York Association for Business Economists. Mr. Moeller earned an M.B.A. in Finance from Fordham University, where he graduated in 1987. He holds a Bachelor of Arts in Economics from George Washington University.
More Economy in Brief


