 Global| Feb 26 2009
U.S. Durable Goods Orders Lowestin Six Years; Latest Six-Month Decline a Record
by:Tom Moeller
|in:Economy in Brief
Summary
The recession in the U.S. factory sector entered an even more dire phase during the last several months. New orders for durable goods fell 5.2% last month after downwardly revised declines of between 4.0% and 8.0% during four of the [...]
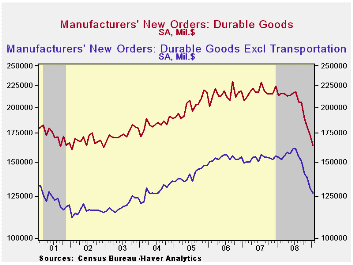 The
recession in the U.S. factory sector entered an even more dire phase
during the last several months. New orders for durable goods
fell 5.2% last month after downwardly revised declines of between 4.0%
and 8.0% during four of the prior five months. Since July new
orders have plummeted 24.9%, a record six-month drop. The
latest decline doubled Consensus expectations for a 2.4% drop.
The
recession in the U.S. factory sector entered an even more dire phase
during the last several months. New orders for durable goods
fell 5.2% last month after downwardly revised declines of between 4.0%
and 8.0% during four of the prior five months. Since July new
orders have plummeted 24.9%, a record six-month drop. The
latest decline doubled Consensus expectations for a 2.4% drop.
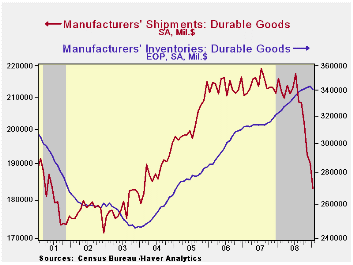
That shortfall in new orders has been aptly followed by lower shipments of durable goods. Off 3.7% in January, the decline followed shortfalls of between 3.0% and 4.0% during four of the prior five months. Year-to-year shipments fell 15.2% and they are down 15.9% during just the last six months. This extreme weakness has brought with it a 17.5% twelve-month decline in industrial production of durable goods. During the last ten years there has been an 83% correlation between the twelve-month change in shipments of durable goods and the change in durables industrial production.
Last month, the production cuts may finally have
succeeded in curbing inventory accumulation. Inventories of
manufactured durables fell 0.8%, the first monthly decline since
2003.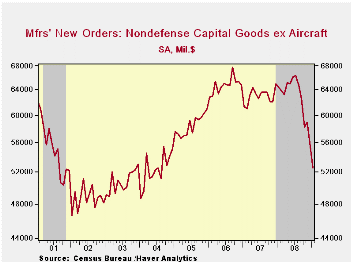 But more efforts to curb the inventory buildup are to
come. Six-month growth still amounted to 1.3%. And
while that's down from the peak, it compares to outright inventory
decumulation at an 8.0% rate during the last recession.
But more efforts to curb the inventory buildup are to
come. Six-month growth still amounted to 1.3%. And
while that's down from the peak, it compares to outright inventory
decumulation at an 8.0% rate during the last recession.
Orders for transportation equipment led last month's decline in orders for durable goods with a 13.5% drop which left them off 38.7% year-to-year. The aircraft sector led that shortfall with a nearly three-quarters drop in nondefense bookings. Orders for motor vehicles & parts fell by a lesser one-third during the last year.
Lower new orders for computers & electronic products followed closely for the top weakest spot in last month's decline with a 5.0% drop (-13.6% y/y) which followed the 7.1% December shortfall. Orders for just computers & related products were the weakest and posted a 16.0% drop and they're off by more than one quarter during the last twelve months. Working the other way were new orders for communications equipment which rose 1.2%. That recovered a piece of the 5.2% decline during December and limited the year-to-year shortfall to just 2.6%.
Most other industries have been notably hard hit by weakening demand. Orders for primary metals fell 4.6% last month and they're down by more than one-third during the last twelve. Machinery orders fell 2.0% last month and they're off 23.0% during the last year. Electrical equipment bookings reversed all of a downwardly revised December gain with a 6.1% flop. They're down by 22.1% during the last twelve months.
 Capital
equipment orders are very much suffering from all this weakness in the
front-end of the economy. They fell 8.8% last month and are down 26.2%
during the last twelve. Orders for nondefense capital goods have been
particularly hard hit and they posted a 28.3% fall just in January.
Alone, aircraft orders have fallen by three-quarters year-to-year. And
without aircraft, nondefense capital goods orders fell 5.4% during
January and by 18.5% during the last twelve months to their lowest
level since 2004. During the last ten years there has been an 80%
correlation between the y/y change in nondefense capital goods orders
and the change in equipment & software spending in the GDP
accounts. The correlation of the GDP figure with capital goods
shipments is, as one would expect, a larger 92%.
Capital
equipment orders are very much suffering from all this weakness in the
front-end of the economy. They fell 8.8% last month and are down 26.2%
during the last twelve. Orders for nondefense capital goods have been
particularly hard hit and they posted a 28.3% fall just in January.
Alone, aircraft orders have fallen by three-quarters year-to-year. And
without aircraft, nondefense capital goods orders fell 5.4% during
January and by 18.5% during the last twelve months to their lowest
level since 2004. During the last ten years there has been an 80%
correlation between the y/y change in nondefense capital goods orders
and the change in equipment & software spending in the GDP
accounts. The correlation of the GDP figure with capital goods
shipments is, as one would expect, a larger 92%.
The durable goods figures are available in Haver's USECON database.
The U.S. Auto Industry from the Federal Reserve Bank of Cleveland can be found here.
| NAICS Classification (%) | January | December | Y/Y | 2008 | 2007 | 2006 |
|---|---|---|---|---|---|---|
| Durable Goods Orders | -5.2 | -4.6 | -23.3 | -5.8 | 1.4 | 6.2 |
| Excluding Transportation | -2.5 | -5.5 | -17.4 | -1.3 | -0.3 | 9.1 |
| Nondefense Capital Goods | -2.7 | -10.2 | -28.3 | -6.7 | 3.5 | 9.4 |
| Excluding Aircraft | -5.4 | -5.8 | -18.5 | -0.3 | -2.7 | 10.7 |
by Tom Moeller February 26, 2009

Sales of new single-family homes during January fell again, to their lowest level in the series' history which dates back to 1963. They dropped 10.2% from December to 309,000 after a 9.5% December decline that was slightly shallower than reported last month. New home sales were off by half and down by three-quarters from their peak during July 2005. January sales even fell short of Consensus expectations for 325,000.
Sales declines around the country have been nothing but
extreme beginning with a 59.9% twelve-month decline in the West. That
is followed by the 50.9% shortfall in the Northeast. Somewhat lesser
declines occurred in the South where sales fell 45.9%
January-to-January and by 33.8% in the Midwest.
The median price for a new single-family home continued to fall severely. At $201,000, the figure was off 9.9% just from December's level which was upwardly revised. The 13.5% year-to-year decline represented the weakest twelve months since 1970 as homebuilders attempted to move inventory. In fact, that effort continued successful and the inventory of unsold homes is down by more than one-quarter during the last year to its lowest level since 2003. In each of the country's regions, the inventory is down by one-quarter to one-third during the last year.
The month's supply of new homes for sale, however, surged to a record 13.3 due to the abysmal sales rate.
The new home sales figures are available in Haver's USECON database.
The Affordability of Homeownership to Middle-Income Americans from the Federal Reserve Bank of Kansas City is available here.
| US New Homes | January | December | Y/Y (%) | 2008 | 2007 | 2006 |
|---|---|---|---|---|---|---|
| Total Sales (SAAR, 000s) | 309 | 344 | -48.2 | 479 | 768 | 1,049 |
| Northeast | 27 | 24 | -50.9 | 35 | 64 | 64 |
| Midwest | 51 | 54 | -33.8 | 69 | 118 | 161 |
| South | 172 | 184 | -45.9 | 264 | 408 | 559 |
| West | 59 | 82 | -59.9 | 111 | 178 | 266 |
| Median Price (NSA, $) | 201,100 | 223,200 | -13.5 | 230,117 | 243,742 | 243,067 |
U.S. Initial Claims For Unemployment Insurance Highest Since 1982; Continuing Claims Another Record
by Tom Moeller February 26, 2009
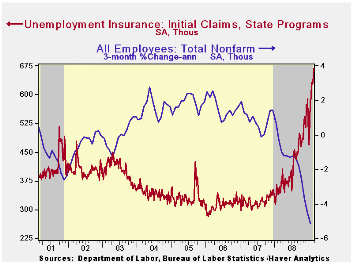
The U.S. labor market weakened ever further as initial claims for unemployment insurance rose to their highest level since 1982. The Labor Department indicated that initial claims for unemployment insurance jumped last week 36,000 to 667,000 and the prior week's figure was revised up slightly. The latest level again surpassed Consensus expectations for 625,000 initial claims.
The Labor Department indicated that in the week ending
February 14, the largest increases in claims were in New Jersey
(+2,093), Virginia (+912), Rhode Island (+493), Vermont (+106), and
South Dakota (+22), while the largest decreases were in California
(-16,550), Kentucky (-7,741), Pennsylvania (-6,547), Illinois (-6,248),
and New York (-3,955)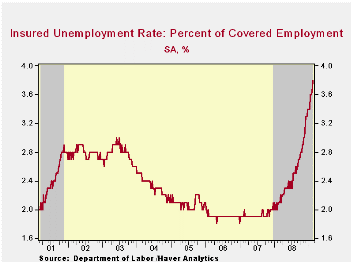
Extreme labor market stress was shown by a the 114,000 increase in continuing claims for unemployment insurance. That followed an upwardly revised 178,000 increase during the prior week. At 5,112,000, the level of continuing claims set yet another record. The series dates back to 1966. The four-week average of continuing claims rose 89,300 to 4,932,2500. Continuing claims provide some indication of workers' ability to find employment and they lag the initial claims figures by one week.
Though the latest level of continuing claims was a record, the labor force has grown as well, by more than 27% over the last twenty years. Therefore, the insured rate of unemployment was not at a new record as it ticked higher to 3.8% which was the highest since 1983. During the last ten years there has been a 93% correlation between the level of the insured unemployment rate and the overall rate of unemployment published by the Bureau of Labor Statistics. The highest insured unemployment rates in the week ending February 7 were in Michigan (7.5 percent), Oregon (7.3), Idaho (7.0), Wisconsin (6.4), Pennsylvania (6.2), Nevada (5.9), Montana (5.7), Rhode Island (5.7), Alaska (5.6), Indiana (5.5), and New Jersey (5.5).
The unemployment insurance claim data is available in Haver's WEEKLY database.
| Unemployment Insurance (000s) | 02/20/09 | 02/13/09 | 02/06/09 | Y/Y | 2008 | 2007 | 2006 |
|---|---|---|---|---|---|---|---|
| Initial Claims | 667 | 631 | 627 | 85.8% | 420 | 321 | 313 |
| Continuing Claims | -- | 5,112 | 4,998 | 86.3% | 3,342 | 2,552 | 2,459 |
EU/EMU Indices Crash Again In February
by Robert Brusca February 26, 2009
As the COIN index had predicted earlier in the week, the Euro
area
continues to labor under downward pressure in February. The sector
indices for EU were mostly lower again in February as the EU sentiment
index was at a new all-time low, at 61. The EMU sentiment index was on
an all-time low as well. No EU sector looks to be anything other than
in bad shape. The best of the sectors (construction) was in the bottom
10 percentile of its range and it still dropped by two points in the
month of February. Retail sales did improve by one point in February to
rise to a reading of -24.
Without splitting hairs, the country indices for sentiment are
all very weak as well.
Looking a bit more closely at sector detail for industry, most
of
the components for this sector worsened on the month and worsened
sharply. For example order volume fell from -49 to -57. Export order
volume fell from a reading of -49 to -58. The production trend fell to
-47 from -39. Employment was trimmed slightly compared to those metrics
falling to -34 from -32. But then, employment does tend to lag other
measures. Germany, France, Italy, Spain and the UK each saw a further
deterioration in their industrial sectors in February.
Consumer confidence has spilled out to its lowest level in EU
history. Its details are not reassuring. Respondents put their
financial situation in the next 12-months in about the bottom 20th of
its historic range. The economic situation in the next 12-months, too,
is assessed as the worst ever. Expectations for unemployment are the
highest in the history of the survey. All this worsens as we realize
that respondents assess the past 12-months as the worst ever (since
1990). Clearly government support/stimulus programs are climbing up a
steep slope to reassure people.
Retailing is somewhat better across EU. Retail sentiment
components
are generally in the bottom 10% to 15% of their respective ranges. The
retail measure itself is in the bottom 7th percentile of its range and
rose by one point on the month. Retailing improved in three of five
major reporting EU nations, and one other country saw the sector’s
sentiment gauge unchanged in Feb.
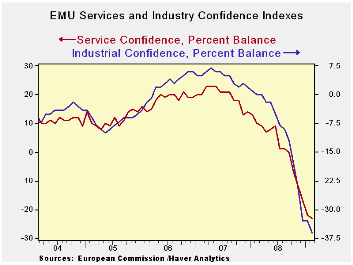
The service sector index fell by one point in EU and it fell
across
its components save for current demand holding steady at a reading of
-19. Expected demand weakened by three points and both current and
expected employment gauges fell. All services indicators were at the
bottom of their respective all-time ranges. The five largest EU
countries all had service sectors that ranked at about the bottom 20th
percentile of their historic ranges.
The EU/EMU survey was uniformly weak again this month. There
is no
sign of stabilization but the rate of descent has slowed a bit in the
last few months. Since we are at all-time lows, that slowing is to be
expected. Still we don’t know if that slowing is for real, if the
slowing in the pace of the drop will reverse, or when the trend might
reverse. The forward-looking aspects of the various surveys are not
encouraging us to be optimistic.
| EU Sectors and Country level Overall Sentiment R-SQ | |||||||||||
|---|---|---|---|---|---|---|---|---|---|---|---|
| EU | Feb 09 |
Jan 09 |
Dec 08 |
Nov 08 |
Percentile | Rank | Max | Min | Range | Mean | w/ Overall |
| Overall | 61 | 63.2 | 66.6 | 73.5 | 0.0 | 220 | 116 | 61 | 55 | 99 | 1.00 |
| Industrial | -37 | -33 | -32 | -25 | 0.0 | 220 | 7 | -37 | 44 | -8 | 0.88 |
| Consumer Confidence | -32 | -31 | -28 | -24 | 0.0 | 220 | 2 | -32 | 34 | -11 | 0.85 |
| Retail | -24 | -25 | -25 | -18 | 3.2 | 218 | 6 | -25 | 31 | -6 | 0.60 |
| Construction | -38 | -36 | -32 | -28 | 8.9 | 206 | 3 | -42 | 45 | -18 | 0.44 |
| Services | -29 | -28 | -23 | -18 | 0.0 | 145 | 32 | -29 | 61 | 15 | 0.86 |
| %m/m | Feb 09 |
Based on Level | Level | ||||||||
| EMU | -2.7% | -2.5% | -10.3% | 65.4 | 0.0 | 220 | 117 | 65 | 52 | 99 | 0.95 |
| Germany | -1.6% | -4.0% | -6.4% | 73.2 | 0.0 | 220 | 121 | 73 | 48 | 99 | 0.68 |
| France | -0.8% | -0.7% | -10.6% | 74.2 | 4.7 | 219 | 119 | 72 | 47 | 99 | 0.81 |
| Italy | -0.4% | -1.4% | -11.7% | 71.6 | 0.0 | 220 | 121 | 72 | 50 | 100 | 0.81 |
| Spain | -3.2% | 3.7% | -7.2% | 67.0 | 0.6 | 219 | 117 | 67 | 50 | 100 | 0.71 |
| Memo: UK | -6.3% | -10.9% | -0.6% | 56.4 | 0.0 | 220 | 117 | 56 | 61 | 100 | 0.55 |
| Since 1990 except Services (Oct 1996)247 | -Count | Services: | 145 | -Count | |||||||
| Sentiment is an index, sector readings are net balance diffusion measures | |||||||||||

Tom Moeller
AuthorMore in Author Profile »Prior to joining Haver Analytics in 2000, Mr. Moeller worked as the Economist at Chancellor Capital Management from 1985 to 1999. There, he developed comprehensive economic forecasts and interpreted economic data for equity and fixed income portfolio managers. Also at Chancellor, Mr. Moeller worked as an equity analyst and was responsible for researching and rating companies in the economically sensitive automobile and housing industries for investment in Chancellor’s equity portfolio. Prior to joining Chancellor, Mr. Moeller was an Economist at Citibank from 1979 to 1984. He also analyzed pricing behavior in the metals industry for the Council on Wage and Price Stability in Washington, D.C. In 1999, Mr. Moeller received the award for most accurate forecast from the Forecasters' Club of New York. From 1990 to 1992 he was President of the New York Association for Business Economists. Mr. Moeller earned an M.B.A. in Finance from Fordham University, where he graduated in 1987. He holds a Bachelor of Arts in Economics from George Washington University.
More Economy in Brief


