 Global| Nov 28 2008
U.S. Durable Goods Orders Lowest Since 2005
by:Tom Moeller
|in:Economy in Brief
Summary
October new orders for durable goods collapsed 6.2% m/m in what was the third consecutive monthly drop. During that period new orders virtually dried up as their 11.5% cumulative decline was the largest since the "credit crunch" [...]
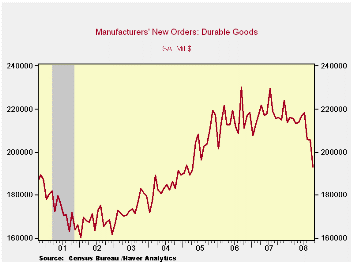
October new orders for durable goods collapsed 6.2% m/m in
what was the third consecutive monthly drop. During that period new
orders virtually dried up as their 11.5% cumulative decline was the
largest since the "credit crunch" recession of 1980. Moreover,
the level of new orders for durables last month was the lowest since
April of 2005. The latest decline followed a revised 0.2%
September downtick and a similar 5.5% August collapse. October's drop
was roughly double the Consensus expectation for a 2.6% shortfall.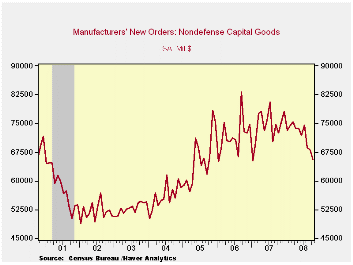
An 11.1% m/m decline in transportation sector orders (-21.6% y/y) led the drop in total durable goods orders last month. Orders for motor vehicles (-23.1% y/y) and for aircraft (-18.1% y/y) both fell sharply.
The industry detail further highlights the recent severe weakness in bookings. Orders for primary metals orders fell 12.6% last month and they're down 29.2% just since July. Machinery orders fell 6.8% last month and they are off 13.0% over the last three periods while October electrical equipment bookings fell 5.3%, off 9.4% during the last three months.
New orders for computers & electronic products also have fallen, but the decline has been not as severe. This total fell 2.4% last month and by 3.5% during the last three. Orders for just computers & related products were quite weak and posted a 5.5% October drop, off 7.2% since July. New orders for communications equipment, however, rose 7.7% last month though that just made up for earlier weakness and they're off 5.0% since July.
The capital equipment sector has shown severe weakness. Orders
for nondefense capital goods fell by 3.6% last month and they were off
by 12.0% since July. Without aircraft, orders were about as weak as the
total and they fell 4.0% last month, off by 9.3% during the last three
months. This was the sharpest negative growth since the 2001 recession.
During the last ten years there has been an 80% correlation between the
y/y gain in nondefense capital goods orders and the rise in equipment
& software spending in the GDP accounts. The correlation of the
GDP figure with capital goods shipments is, as one would expect, a
larger 92%.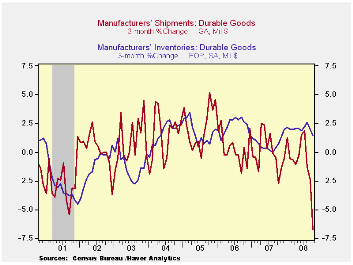
Reflecting past weakness in new orders, overall shipments of
durable goods fell 2.4%. Their decline during the last three months
totaled 6.7% after a 0.1% uptick last year. For comparison, industrial
production of durable goods during the last three months fell 6.2%.
During the last ten years there has been a 69% correlation between the
three-month change in shipments of durable goods and the change in
durables industrial production. Less transportation, shipments of
durable goods fell 1.7% last month and by 5.4% during the last three
months.
Accumulation of inventories of manufactured products has yet to respond to a weaker shipments' growth environment. Inventories of manufactured durables rose 0.4% in October after a 0.2% September increase. The latest gains left three-month growth at 1.5%; hardly a strong rate of increase. In fact it was lower than the recent high of 2.6%. Still, it clearly is too fast for an environment when shipments over the last three months have fallen 6.7%. Tight inventory management techniques today are fostering a fast reaction to changes in the demand environment. Or maybe not. The ratio of inventories-to-shipments rose last month to its highest level since 1996. Clearly, an unwinding of this unwanted inventory buildup has yet to provide downward pressure on factory output.
Monetary Policy and Asset Prices from the Federal Reserve Bank of San Francisco is available here.
| NAICS Classification (%) | October | September | August | Y/Y | 2007 | 2006 | 2005 |
|---|---|---|---|---|---|---|---|
| Durable Goods Orders | -6.2 | -0.2 | -5.5 | -10.6 | 1.4 | 6.2 | 10.2 |
| Excluding Transportation | -4.4 | -2.3 | -4.2 | -6.1 | -0.3 | 9.1 | 9.1 |
| Nondefense Capital Goods | -3.6 | -1.0 | -7.8 | -9.5 | 3.5 | 9.4 | 17.3 |
| Excluding Aircraft | -4.0 | -3.3 | -2.3 | -3.3 | -2.7 | 10.7 | 11.6 |
by Tom Moeller November 28, 2008
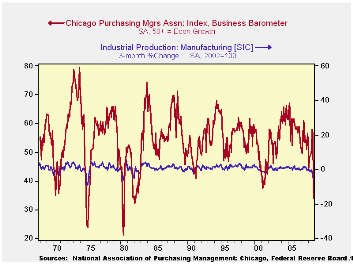
The Chicago Purchasing Manager's Association indicated that
its November business barometer fell to 33.8 after the collapse during
October. The latest figure was the lowest since early during the sharp
recession of 1982. Consensus expectations had been for a reading of
37.3.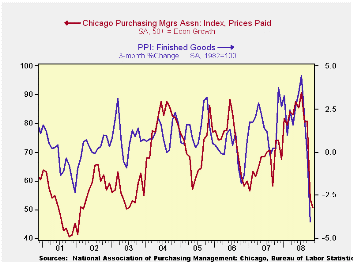
During the last ten years there has been a 67% correlation between the business barometer and the three-month change in US factory sector industrial production. There has been an 85% correlation between the Chicago figure and the national ISM index (due for release tomorrow) and that is the highest correlation of all the regional series with the national ISM index.
The new orders sub-index fell to 27.2, the lowest since 1980, and the index level is off by roughly one-half during just the last two months. Order backlogs also fell sharply. The production series ticked slightly after having more-than halved during October.
The employment index, at 33.4, was near its lowest level since the last recession. During the last thirty years there has been a 72% correlation between the level of the employment index and the three-month change in nonfarm payrolls. 1
The prices paid index fell further after having declined sharply during October. The current index level of 50.7 is nearly half the July high. During the last ten years there has been a 55% correlation between the price index and the three-month change in the finished goods PPI.
The Mortgage Meltdown, Financial Markets, and the Economy from the Federal Reserve Bank of San Francisco can be found here.
| Chicago PMI | November | October | September | November '07 | 2007 | 2006 | 2005 |
|---|---|---|---|---|---|---|---|
| Chicago PMI Business Barometer Index | 33.8 | 37.8 | 56.7 | 53.6 | 54.4 | 56.8 | 60.4 |
by Robert Brusca November 28, 2008
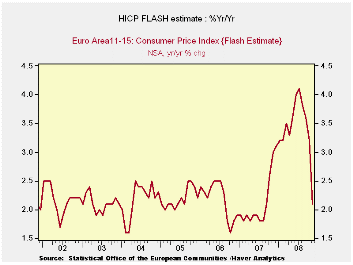
The Euro Area reported a dramatically deflated CPI (HICP,
Harmonized index of consumer prices) for November. The index dropped
its rate of inflation back to 2.1% from 3.2%, a huge deceleration (in
one month!) for yr/yr inflation that owes to the plunge in world oil
and energy prices. With a self-imposed limit for headline consumer
inflation of 2% the ECB can now feel it is no longer in violation of
the spirit of its ‘guideline’. And with inflation falling so sharply a
forward-looking expectation of being inside the target would be prudent
and reasonable.
Core inflation in the EMU is still not available. But the
history shows that that measure has been much better corralled overall.
Through October the three-month pace for core inflation was 2.4%
compared to 2.4% for Yr/Yr core inflation.
Of course the ECB has long since jettisoned any such technical
concerns of being in violation of its ceiling, as it has joined other
central banks in a round of international rate-cutting. The ECB
recognizes the downside risks but still has had this issue with the
inflation rate being so far over its ceiling. The drop in the rate this
month may be all the more important as the Federal Reserve in the US is
pulling out even more stops to lend to banks and issue liquidity as
well as to target mortgage rate reductions with a panoply of moves that
have some Fed critics warning of inflation consequences even as the
economy faces what could be a quarter of -5% real growth (annualized).
In such an environment the ECB at least has the comfort of
getting its inflation rate back close enough to target range that it
can again feel that it is making policy with some degree of comfort,
prudence and discretion.
Still, there should be no sense that all is well. The drop in
headline inflation merely gives the ECB its appearance of propriety
back - not its ‘Mo-Jo.’ The Federal Reserve in the US has made the most
moves of any central bank but part of its mix of policies has been to
provide swap facilities for dollars to aid central banks abroad.
Central banks are still ‘riding the tiger’. About a week ago US
Treasury Secretary Paulson dared to commit the ‘in-crisis’ error of
saying that banks had been stabilized, only to find that that they had
not as Citigroup saw its stock drop and a new special action by the
Fed/treasury was required. Clearly the financial situation remains
fragile though it appears to be less degenerative than it was. Now
policymakers are turning attention more to the economy. At a time like
this with Europe looking weaker and the German economy set to import a
good deal of weakness from trade as its exports drop, the ECB can use
an extra-measure of flexibility. It is hard to say that this drop in
inflation came ‘just in time’ but at least we can say ‘better late than
never’.
| Trends in EMU HICP; Flash Index | |||||||
|---|---|---|---|---|---|---|---|
| % mo/mo | % saar | ||||||
| Nov-08 | Oct-08 | Sep-08 | 3-Mo | 6-Mo | 12-Mo | Yr Ago | |
| EMU-13 | -0.3% | 0.0% | 0.1% | -0.8% | 0.7% | 2.1% | 3.1% |
| Core | #N/A | 0.2% | 0.1% | 2.4% | 2.2% | 2.4% | 2.1% |
| Goods | #N/A | 0.0% | 0.8% | 1.4% | 1.4% | 3.5% | 2.6% |
| Services | #N/A | 0.1% | -0.7% | -1.3% | 2.5% | 2.6% | 2.5% |
| HICP | |||||||
| Germany | 0.0% | -0.3% | 0.2% | -0.4% | 1.1% | 1.5% | 3.3% |
| France | #N/A | 0.1% | 0.0% | -0.7% | 1.8% | 3.0% | 2.1% |
| Italy | -0.4% | 0.3% | 0.0% | -0.4% | 1.7% | 2.8% | 2.6% |
| UK | #N/A | -0.4% | 0.6% | #N/A | #N/A | #N/A | 2.1% |
| Spain | #N/A | -0.3% | 0.0% | -1.5% | 2.6% | 3.6% | 3.7% |
| Core:xFE&A | |||||||
| Germany | #N/A | -0.1% | 0.0% | 0.8% | 1.7% | 1.5% | 2.1% |
| Italy | #N/A | 0.5% | 0.0% | 4.6% | 3.0% | 3.0% | 2.1% |
| UK | #N/A | #N/A | 0.0% | #N/A | #N/A | #N/A | 1.8% |
| Spain | #N/A | 0.1% | 0.1% | 2.4% | 3.1% | 2.9% | 3.1% |
| Blue shaded area data trail by one month. | |||||||

Tom Moeller
AuthorMore in Author Profile »Prior to joining Haver Analytics in 2000, Mr. Moeller worked as the Economist at Chancellor Capital Management from 1985 to 1999. There, he developed comprehensive economic forecasts and interpreted economic data for equity and fixed income portfolio managers. Also at Chancellor, Mr. Moeller worked as an equity analyst and was responsible for researching and rating companies in the economically sensitive automobile and housing industries for investment in Chancellor’s equity portfolio. Prior to joining Chancellor, Mr. Moeller was an Economist at Citibank from 1979 to 1984. He also analyzed pricing behavior in the metals industry for the Council on Wage and Price Stability in Washington, D.C. In 1999, Mr. Moeller received the award for most accurate forecast from the Forecasters' Club of New York. From 1990 to 1992 he was President of the New York Association for Business Economists. Mr. Moeller earned an M.B.A. in Finance from Fordham University, where he graduated in 1987. He holds a Bachelor of Arts in Economics from George Washington University.
More Economy in Brief


