 Global| Feb 24 2005
U.S. Durable Goods Orders Lower in January, Trend Strong
by:Tom Moeller
|in:Economy in Brief
Summary
Durable goods orders fell 0.9% in January following an upwardly revised gain in December of 1.4%. Consensus expectations had been for no change. Orders for transportation equipment weakened during the last two months, down 5.3% in [...]
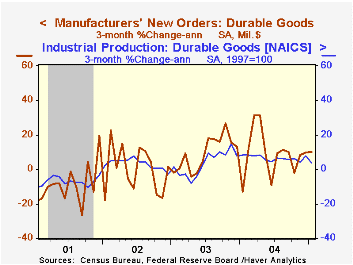
Durable goods orders fell 0.9% in January following an upwardly revised gain in December of 1.4%. Consensus expectations had been for no change.
Orders for transportation equipment weakened during the last two months, down 5.3% in January and 2.2% in December due to huge declines in commercial and defense aircraft orders. Less transportation, durable goods orders rose 0.8% (13.2% y/y) last month following an upwardly revised 2.8% December increase.
Nondefense capital goods orders rose 0.2% but less aircraft orders rose 2.9% after an upwardly revised 3.3% December spurt.
Orders for computers & electronic products fell 1.2% (+11.1% y/y) following the upwardly revised 8.3% surge in December. Electrical equipment orders jumped 13.1% (14.6% y/y) and machinery orders rose 0.3% (18.3% y/y). Primary metals orders logged a third consecutive month of strength with a 1.6% rise (27.2% y/y) and orders for fabricated metals rose 1.2% as well (+7.6% y/y).
Inventories of durable goods jumped 0.9% (8.6% y/y). Combined with a 1.5% (12.4% y/y) surge in shipments, which followed a 2.8% December jump, the I/S ratio fell to the lowest level since last May.
Unfilled orders slipped 0.2%, the first monthly decline in a year (+8.9% y/y). As shipments surged during the last two months, the ratio of backlogs to shipments reversed nearly all of last year's gains.
| NAICS Classification | Jan | Dec | Y/Y | 2004 | 2003 | 2002 |
|---|---|---|---|---|---|---|
| Durable Goods Orders | -0.9% | 1.4% | 11.6% | 10.8% | 2.6% | -1.7% |
| Nondefense Capital Goods | 0.2% | -0.7% | 18.8% | 13.7% | 5.6% | -7.2% |
| Excluding Aircraft | 2.9% | 3.3% | 17.0% | 11.7% | 6.6% | -7.1% |
by Tom Moeller February 24, 2005
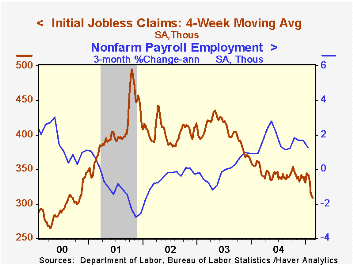
Initial claims for unemployment insurance 9,000 to 312,000 last week following three weeks of sharp decline. The prior week's level was little revised and Consensus expectations had been for 309,000 claims.
Despite the increase, claims in February are 7.8% below the January average. The four week moving average of initial claims fell to 308,750 (-14.6% y/y).
Continuing claims for unemployment insurance fell 62,000 following a deepened 19,000 decline the prior week.
During the last ten years there has been a (negative) 75% correlation between the level of initial claims for unemployment insurance and the monthly change in payroll employment. There has been a (negative) 66% correlation with the level of continuing claims.
The insured rate of unemployment was stable at a low 2.1%.
The February 2005 Minutes of the Federal Open Market Committee meeting are available here.
Expectations and the Monetary Policy Transmission Mechanism from the Federal Reserve Bank of Kansas City can be found here.
| Unemployment Insurance (000s) | 02/19/05 | 02/12/05 | Y/Y | 2004 | 2003 | 2002 |
|---|---|---|---|---|---|---|
| Initial Claims | 312 | 303 | -11.4% | 343 | 402 | 404 |
| Continuing Claims | -- | 2,650 | -15.8% | 2,926 | 3,531 | 3,570 |
by Tom Moeller February 24, 2005
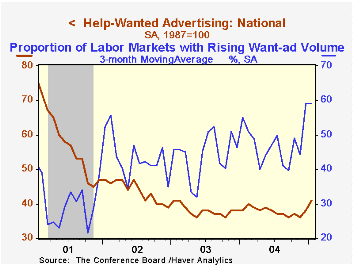
The Conference Board's National Index of Help-Wanted Advertising rose to 41 in January, the highest level in nearly two years.
During the last ten years there has been an 88% correlation between the level of help-wanted advertising and the year-to-year change in non-farm payrolls.
The proportion of labor markets with rising want-ad volume held at a high 71%, indicative of broad based gains.
The Conference Board surveys help-wanted advertising volume in 51 major newspapers across the country every month.
The latest help wanted report from the Conference Board is available here.
Help-Wanted Advertising and Job Vacancies from the Federal Reserve Bank of San Francisco can be found here.
| Conference Board | Jan | Dec | Jan '04 |
|---|---|---|---|
| National Help Wanted Index | 41 | 38 | 38 |
by Tom Moeller February 24, 2005
The average price for unleaded regular gasoline rose to $1.91 per gallon last week and the average price this month of $1.90 is up versus the low of $1.83 in January.
The price of oil firmed even more with the price of West Texas Intermediate crude rising over $50.00 per barrel.
Wholesale natural gas prices moderated last week to $6.02/mmbtu (+11.1% y/y).
For the latest Short Term Energy Outlook from the US Department of Energy click here.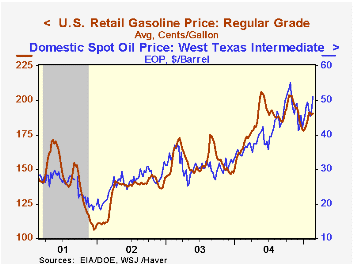

| Energy Prices | 02/21/05 | 12/31/04 | Y/Y | 2004 | 2003 | 2002 |
|---|---|---|---|---|---|---|
| US Retail Gasoline, Regular ($/Gal.) | $1.91 | $1.79 | 12.9% | $1.85 | $1.56 | $1.35 |
| Domestic Spot Market Price: West Texas Intermediate ($/Barrel) | $51.16 | $41.78 | 41.8% | $41.78 | $32.78 | $31.23 |

Tom Moeller
AuthorMore in Author Profile »Prior to joining Haver Analytics in 2000, Mr. Moeller worked as the Economist at Chancellor Capital Management from 1985 to 1999. There, he developed comprehensive economic forecasts and interpreted economic data for equity and fixed income portfolio managers. Also at Chancellor, Mr. Moeller worked as an equity analyst and was responsible for researching and rating companies in the economically sensitive automobile and housing industries for investment in Chancellor’s equity portfolio. Prior to joining Chancellor, Mr. Moeller was an Economist at Citibank from 1979 to 1984. He also analyzed pricing behavior in the metals industry for the Council on Wage and Price Stability in Washington, D.C. In 1999, Mr. Moeller received the award for most accurate forecast from the Forecasters' Club of New York. From 1990 to 1992 he was President of the New York Association for Business Economists. Mr. Moeller earned an M.B.A. in Finance from Fordham University, where he graduated in 1987. He holds a Bachelor of Arts in Economics from George Washington University.
More Economy in Brief


