 Global| Apr 24 2008
U.S. Durable Goods Orders Dipped Unexpectedly
by:Tom Moeller
|in:Economy in Brief
Summary
During March, new orders for durable manufactured goods dipped 0.3% after falling 0.9% in February, a decline which was less than the 1.7% drop reported initially. Consensus expectations had been for a slight 0.1% uptick in March [...]
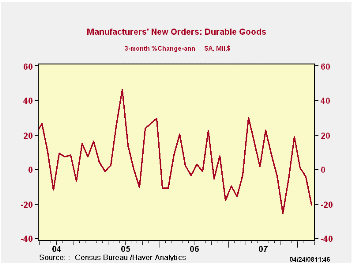
During March, new orders for durable manufactured goods dipped 0.3% after falling 0.9% in February, a decline which was less than the 1.7% drop reported initially. Consensus expectations had been for a slight 0.1% uptick in March orders and it was the third consecutive m/m decline.
Outsized weakness was registered in the transportation sector where new orders fell 4.6%. Excluding the volatile transportation sector durable goods orders rose 1.5%, double the expected gain. A 2.1% February decline in orders was little revised.
The 4.6% decline in transportation equipment orders was led by a 4.6% (-14.7% y/y) downdraft in orders for motor vehicles & parts. That was partially offset by a 10.7% gain in new orders for aircraft & parts. Orders for nondefense aircraft & parts rose 5.5% (-18.9% y/y), about the same as they did in February.
Orders for nondefense capital goods rose 1.5% after a revised 0.3% dip during February. During the last ten years there has been an 80% correlation between the y/y gain in nondefense capital goods orders and the rise in equipment & software spending in the GDP accounts. The correlation with capital goods shipments is, as one would expect, a larger 92%.
March new orders for nondefense capital goods less aircraft
were unchanged, following a little revised 2.0% February decline which
was double the 1.0% drop during January.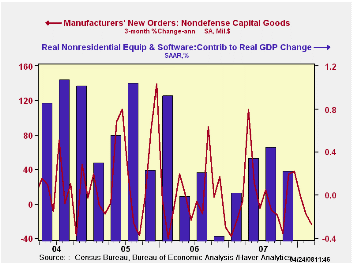
Orders for machinery rose 6.2% (1.9% y/y) and recovered about half of the February decline.Computers & related products orders rose 1.6% on the heels of February's 11.3% surge while new orders for communications equipment dipped 0.3%. More extreme weakness in these orders is indicated by the sharp 19.2% decline from their peak level last July. Primary metal orders ticked up 0.2% (6.3% y/y).
Overall shipments of durable goods dipped 0.4% (+0.4% y/y) as shipments from the transportation sector fell 1.9% (-5.3% Y/Y). Less transportation, shipments ticked up 0.2% (2.5% y/y).
Inventories of durable goods backed up by 1.1% (5.1% y/y). The three month gain in durable goods inventories remained about steady with the prior several months at 8.6% (AR). That is, however, sharply elevated from the -0.1% rate of decumulation last August. Less transportation, inventories also rose at an accelerated 4.9% rate during the last three months.
Maintaining Stability in a Changing Financial System: Some Lessons Relearned Again? From the Federal Reserve Bank of Kansas City can be found here.
| NAICS Classification | March | February | Y/Y | 2007 | 2006 | 2005 |
|---|---|---|---|---|---|---|
| Durable Goods Orders | -0.3% | -0.9% | -2.1% | 0.9% | 6.3% | 9.9% |
| Excluding Transportation | 1.5% | -2.1% | 2.2% | 0.2% | 7.6% | 8.8% |
| Nondefense Capital Goods | 1.5% | -0.3% | -3.3% | 3.5% | 10.6% | 17.1% |
| Excluding Aircraft | 0.0% | -2.0% | 1.7% | -1.6% | 8.5% | 11.1% |
by Tom Moeller April 24, 2008
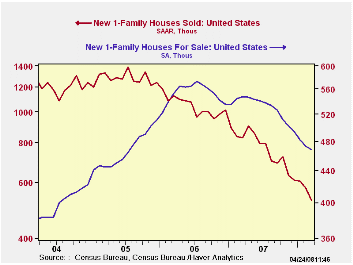
During March, new single family home sales fell 8.5%. The
decline to 526,000 followed a 5.3% drop during February that was
revised deeper from the initial report. A March sales level of 585,000
had been expected. The latest level of sales was the lowest since 1991.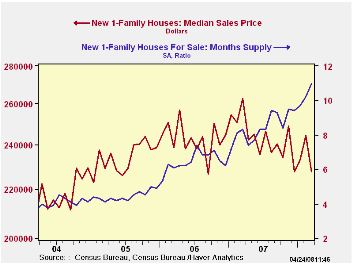
By region, double digit month-to-month declines were logged in the Northeast (-64.6% y/y), in the Midwest (-50.0% Y/Y) and in the West (-39.3% y/y). In the South new home sales fell by a lesser 4.6% m/m (-25.9% y/y).
The median price for a new single family home fell 6.8% to
$227,600 and reduced prices to near their lowest since 2004.
The number of new homes for sale fell 1.1% last month (-14.6% y/y). That inventory was down 18.3% from the peak in mid-2006.
Will Rural Prosperity Prevail in 2008? from the Federal Reserve Bank of Kansas City is available here.
| US New Homes | March | February | Y/Y | 2007 | 2006 | 2005 |
|---|---|---|---|---|---|---|
| Total Sales (SAAR, 000s) | 526 | 575 | -36.6% | 773 | 1,049 | 1,279 |
| Median Price (NSA, $) | 227,600 | 244,200 | -13.3% | 243,500 | 243,067 | 234,208 |
by Tom Moeller April 24, 2008
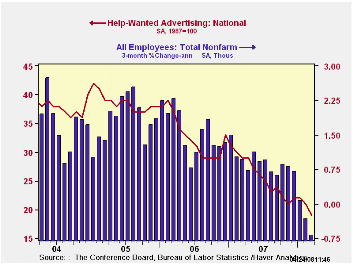
The index of help-wanted advertising reported by the Conference Board fell sharply last month to 19 from an unrevised 21 in February. The latest level was a new record low.
During the last ten years there has been a 57% correlation between the level of help-wanted advertising and the three month change in non-farm payrolls.
The proportion of labor markets with rising want-ads rose slightly to a still low 39%. The latest was nevertheless improved from 12% in August which was the lowest monthly reading since October 2001.
Each region of the country showed a m/m decline in its help wanted index except the Middle Atlantic and the New England regions.
The Conference Board surveys help-wanted print advertising volume in 51 major newspapers across the country every month. The latest help wanted report from the Conference Board is available here.
In 2006, the Conference Board introduced its Help Wanted Online Data Series and the latest release can be found in this link.
| Conference Board | March | February | March 2007 | 2007 | 2006 | 2005 |
|---|---|---|---|---|---|---|
| National Help Wanted Index | 19 | 21 | 29 | 26 | 33 | 39 |
by Tom Moeller April 24, 2008
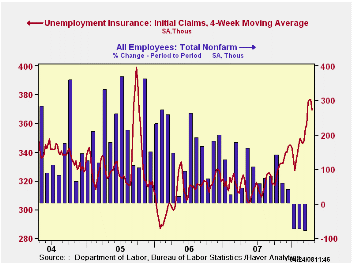
Unexpectedly, initial unemployment insurance claims fell
33,000 last week to 342,000. The decline followed a little revised
20,000 increase during the prior week and it dropped claims to the
lowest level in two months. Consensus expectations had been for claims
to total 375,000 last week.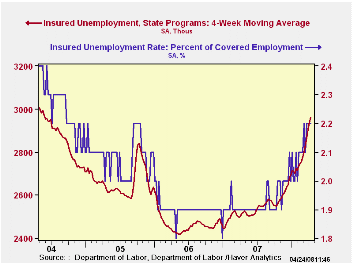
A claims level below 400,000 typically has been associated with growth in nonfarm payrolls. During the last ten years there has been a (negative) 76% correlation between the level of initial claims and the m/m change in nonfarm payroll employment.
The four week moving average of initial claims fell to 369,500 (14.0% y/y), its lowest level in a month.
Continuing claims for unemployment insurance fell 65,000 after an upwardly revised 46,000 increase during the prior week. The figure provides some indication of workers' ability to find employment.
The continuing claims numbers lag the initial claims figures by one week.
The insured rate of unemployment held steady at 2.2% for the fifth week in the last six.
| Unemployment Insurance (000s) | 04/19/08 | 04/12/08 | Y/Y | 2007 | 2006 | 2005 |
|---|---|---|---|---|---|---|
| Initial Claims | 342 | 375 | 8.2% | 322 | 313 | 331 |
| Continuing Claims | -- | 2,934 | 14.8% | 2,552 | 2,459 | 2,662 |
by Robert Brusca April 24, 2008
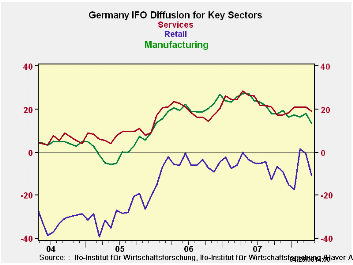
Germany’s IFO index has dropped sharply in March to 102.4 from 104.8. Its current conditions index fell to 109.4 from 111.5. The April expectations index moved lower to 96.8 from 98.4. On a Yr/Yr basis the percentage declines in the IFO index accelerated for each of these components (see table below).
The readings for the IFO and its components are not yet dour, but they clearly have weakened and are no longer strong. The Business Climate index stands in the 73rd percentile of its range, a firm reading. The current situation is a bit better than that, lodged at its 78th percentile. Expectations, the forward-looking indicator, are weaker; still standing in the 60th percentile of their range. That is still above the midpoint but longer looking very strong and certainly losing momentum. Expectations readings, while above their range mid point stand at their period average at a value of 96.8.
The sector indices tell curious stories. Compared to their respective average values since January of 2001, all are still well above average. But all are not well-off. Retailing is the most curious having moved strongly higher earlier this year even as the euro was gaining in value. But in April it is falling sharply even as it was retaining some of those gains. The message from this sector is not clear. It resides in the 78th percentile of its range. In that respect it is the relative strongest of the sectors in its range since 2001. Wholesaling is the weakest sector residing in the 65th percentile of its range. MFG Construction and retailing are in the low seventieth percentiles of their respective ranges. All of them fell in the month, retailing fell the mostly sharply shedding 10 points in one month. Wholesaling lost over 6 points on its diffusion index. Manufacturing lost about four and one-half points.
It was not a good month for the IFO report that was generally worse than the Zew index has suggested. The IFO’s details are yet to be revealed. A MFG morale report from neighboring France, a fellow EMU member, (also released today) showed that French morale was off and that orders had dropped sharply. That result accords with the Belgian National Bank index released on Wednesday, just one day ago. We are getting confirming signs with similar causes about spreading weakness in the Euro Area. Even the UK’s CBI MFG survey showed a similar pattern of weakness made more nettlesome by reports that more firms were passing through price increases.
The reports for the EMU in the coming months are going to be important. On today’s weakness the Euro shed a large dollop of its recent outsized dollar gains. The ECB rhetoric about tightening rates has done a quick 180-degree turn, suddenly the IMF is pleased with the state of ECB policy and the ECB itself no longer seems to threaten a rate-hiking agenda.
What a difference a few bad economic reports can make. Stay tuned as we try to discern how weak things will get. For its part the German government has not cut its growth rate further for 2008 but has lowered the outlook for 2009. In the face of all the complaining that the euro is too strong, some of this is going have to undergo a credibility check. If the euro is far, far above parity (and seems to suggest that is so) then the recent strength in a number of euro indicators would seem to at risk. More weak readings from the IFO and its companion reports must lie ahead. All this talk of a resilient and robust economy in Europe surely must be about to go by the boards.
| IFO Survey: Germany | ||||||||
|---|---|---|---|---|---|---|---|---|
| Percent: Yr/Yr | INDEX NUMBERS | |||||||
| Apr-08 | Mar-08 | Feb-08 | Jan-08 | Dec-07 | CURRENT | Average | Percentile | |
| Biz Climate | -5.7% | -2.7% | -2.7% | -4.2% | -5.3% | 102.4 | 96.0 | 73.1% |
| Current Situation | -4.2% | -0.7% | -1.1% | -4.3% | -6.2% | 108.4 | 95.2 | 78.6% |
| Biz Expectations | -7.2% | -4.7% | -4.4% | -4.1% | -4.3% | 96.8 | 96.8 | 60.5% |

Tom Moeller
AuthorMore in Author Profile »Prior to joining Haver Analytics in 2000, Mr. Moeller worked as the Economist at Chancellor Capital Management from 1985 to 1999. There, he developed comprehensive economic forecasts and interpreted economic data for equity and fixed income portfolio managers. Also at Chancellor, Mr. Moeller worked as an equity analyst and was responsible for researching and rating companies in the economically sensitive automobile and housing industries for investment in Chancellor’s equity portfolio. Prior to joining Chancellor, Mr. Moeller was an Economist at Citibank from 1979 to 1984. He also analyzed pricing behavior in the metals industry for the Council on Wage and Price Stability in Washington, D.C. In 1999, Mr. Moeller received the award for most accurate forecast from the Forecasters' Club of New York. From 1990 to 1992 he was President of the New York Association for Business Economists. Mr. Moeller earned an M.B.A. in Finance from Fordham University, where he graduated in 1987. He holds a Bachelor of Arts in Economics from George Washington University.
More Economy in Brief


