 Global| Dec 23 2009
U.S. Disposable Personal Income& Spending Continue Firm
by:Tom Moeller
|in:Economy in Brief
Summary
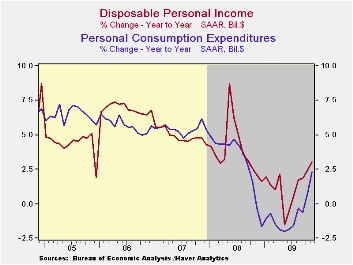
Tax breaks continued to spur growth in disposable personal income. Last month's 0.5% gain followed an upwardly revised 0.5% October increase. A decline in tax payments (-25.7% y/y), which began early in 2008, helped spur y/y [...]
 Tax breaks
continued to spur growth in disposable personal income.
Last month's 0.5% gain followed an upwardly revised 0.5% October
increase. A decline in tax payments (-25.7% y/y), which began early in
2008, helped spur y/y disposable income growth to 3.1%. Adjusted for a
0.2% (1.5% y/y) rise in the chain price index, real disposable income
rose 0.2% (1.5% y/y) for the third consecutive month.
Tax breaks
continued to spur growth in disposable personal income.
Last month's 0.5% gain followed an upwardly revised 0.5% October
increase. A decline in tax payments (-25.7% y/y), which began early in
2008, helped spur y/y disposable income growth to 3.1%. Adjusted for a
0.2% (1.5% y/y) rise in the chain price index, real disposable income
rose 0.2% (1.5% y/y) for the third consecutive month.
 Personal
spending rose 0.5% after a 0.6% October increase which was
double the initial estimate. The rise fell short of the 0.7% increase
which was the Consensus expectation. Durables spending jumped 1.1%
(2.5% y/y) as spending on motor vehicles gained another 2.2% (7.9% y/y)
following a 9.5% October surge. Spending on other durables, however,
remained lackluster. Furniture & appliance purchases fell
slightly for the second month and were off 2.9% y/y. Spending on
nondurables increased 1.5% (4.6% y/y) as outlays on gasoline jumped
7.2% (18.6% y/y) with higher prices. In constant dollars gasoline
outlays rose just 0.9% and were down slightly y/y. Spending on clothing
slipped 0.3% (-1.1% y/y) though that y/y change is improved from 6.8%
decline at the worst of the recent recession. Outlays on services were
unchanged (1.5% y/y). Spending on health care rose 0.4% (4.8% y/y) but
housing & utilities spending fell 0.4% (+0.2% y/y).
Personal
spending rose 0.5% after a 0.6% October increase which was
double the initial estimate. The rise fell short of the 0.7% increase
which was the Consensus expectation. Durables spending jumped 1.1%
(2.5% y/y) as spending on motor vehicles gained another 2.2% (7.9% y/y)
following a 9.5% October surge. Spending on other durables, however,
remained lackluster. Furniture & appliance purchases fell
slightly for the second month and were off 2.9% y/y. Spending on
nondurables increased 1.5% (4.6% y/y) as outlays on gasoline jumped
7.2% (18.6% y/y) with higher prices. In constant dollars gasoline
outlays rose just 0.9% and were down slightly y/y. Spending on clothing
slipped 0.3% (-1.1% y/y) though that y/y change is improved from 6.8%
decline at the worst of the recent recession. Outlays on services were
unchanged (1.5% y/y). Spending on health care rose 0.4% (4.8% y/y) but
housing & utilities spending fell 0.4% (+0.2% y/y).
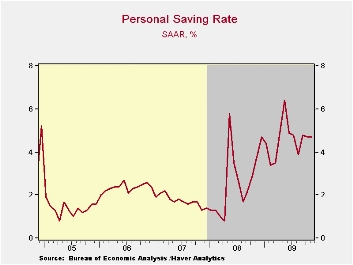
As a result of tax cuts and moderate spending, the savings rate held steady at the upwardly revised 4.7% October level. The rate has risen sharply from near 1.0% at the beginning of last year.
 Overall personal
income gained 0.4% during November after an upwardly revised
0.3% October increase. The latest figure fell short of Consensus
expectations for a 0.5% rise. Wages & salaries rose 0.3% due to
the pickup in average hourly earnings reported with the jobs numbers.
Nevertheless, year-to-year growth in wages continued negative (-2.8%
y/y), only slightly improved from the worst y/y growth of this cycle.
Wages in the factory sector rose 0.2% (-10.4% y/y) after a 0.4% October
decline. In the service sector wages rose a firmer 0.4% (-1.7% y/y).
Though wages in the government sector only ticked up 0.1% last month,
the 2.9% y/y gain easily outpaced the 4.1% decline in private sector
earnings.
Overall personal
income gained 0.4% during November after an upwardly revised
0.3% October increase. The latest figure fell short of Consensus
expectations for a 0.5% rise. Wages & salaries rose 0.3% due to
the pickup in average hourly earnings reported with the jobs numbers.
Nevertheless, year-to-year growth in wages continued negative (-2.8%
y/y), only slightly improved from the worst y/y growth of this cycle.
Wages in the factory sector rose 0.2% (-10.4% y/y) after a 0.4% October
decline. In the service sector wages rose a firmer 0.4% (-1.7% y/y).
Though wages in the government sector only ticked up 0.1% last month,
the 2.9% y/y gain easily outpaced the 4.1% decline in private sector
earnings.
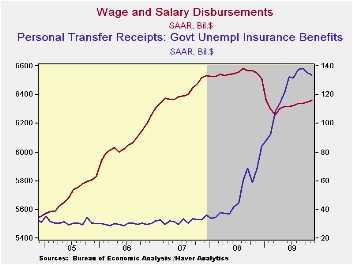 Growth in
unemployment insurance payments slowed
further as joblessness fell. In fact, moderate declines during the last
two months compare with the y/y doubling earlier this year. Interest
income rose 0.2% (-4.6% y/y) as the decline in rates found a bottom
while another 0.9% m/m increase in dividend income
nevertheless left it down 18.0% y/y with the weaker economy.
Growth in
unemployment insurance payments slowed
further as joblessness fell. In fact, moderate declines during the last
two months compare with the y/y doubling earlier this year. Interest
income rose 0.2% (-4.6% y/y) as the decline in rates found a bottom
while another 0.9% m/m increase in dividend income
nevertheless left it down 18.0% y/y with the weaker economy.
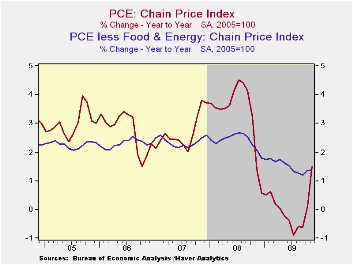
The PCE chain price index increased a moderate 0.2% during November led by a 6.2% (18,5% y/y) increase in gasoline costs. Less food-and-energy, "core" prices were unchanged. Prices for durable goods were off 0.1% (-1.1% y/y) as home furnishing prices fell 0.5% (-2.1% y/y) and apparel prices also fell 0.5% (+0.8% y/y). Prices for services gained a steady 1.2% y/y.
The personal income & consumption figures are available in Haver's USECON and USNA databases.
| Disposition of Personal Income (%) | November | October | September | Y/Y | 2008 | 2007 |
|---|---|---|---|---|---|---|
| Personal Income | 0.4 | 0.3 | 0.3 | -0.3 | 2.9 | 5.6 |
| Disposable Personal Income | 0.5 | 0.5 | 0.3 | 3.1 | 3.9 | 4.9 |
| Personal Consumption Expenditures | 0.5 | 0.6 | -0.6 | 2.3 | 3.1 | 5.4 |
| Saving Rate | 4.7 | 4.7 | 4.8 | 3.8 (Nov.'08) | 2.6 | 1.7 |
| PCE Chain Price Index | 0.2 | 0.3 | 0.1 | 1.5 | 3.3 | 2.7 |
| Less food & energy | 0.0 | 0.2 | 0.1 | 1.4 | 2.4 | 2.4 |
Michigan Consumer Sentiment Increases Smartly
by Tom Moeller December 23, 2009
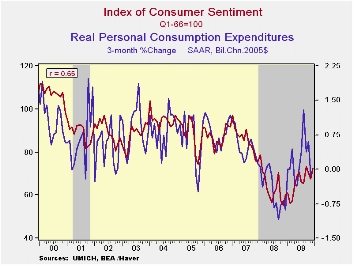 Though the
December Reuters/University of Michigan Index of Consumer Sentiment
slipped from mid-month, is 7.6% increase to 72.5 recovered most of the
declines during the prior two months. The latest figure fell short of
Consensus expectations for a level of 73.8. Nevertheless, sentiment was
up sharply from its low last Fall. During the last ten years there has
been a two-thirds correlation between the level of sentiment and the
three-month change real consumer spending.
Though the
December Reuters/University of Michigan Index of Consumer Sentiment
slipped from mid-month, is 7.6% increase to 72.5 recovered most of the
declines during the prior two months. The latest figure fell short of
Consensus expectations for a level of 73.8. Nevertheless, sentiment was
up sharply from its low last Fall. During the last ten years there has
been a two-thirds correlation between the level of sentiment and the
three-month change real consumer spending.
Sentiment about current economic conditions jumped 13.4% from November to the highest level since March of last year. Assessments of current financial conditions improved to the highest since September of last year. Buying conditions for large household goods, including furniture, refrigerators, stoves & televisions, also moved up by 12.3% to the highest level since January 2008.
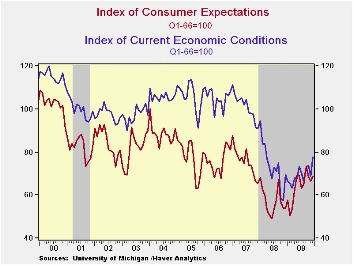 The
full-month December reading on expected economic conditions recovered
its November decline with a 3.6% increase to the highest level since
September. The outlook for business conditions during the next twelve
months improved sharply and recovered most of November's decline but
the expected business conditions during the next five years fell and
expected personal finances advanced just modestly. All three of these
readings recently have been flat after sharp improvement early this
year.
The
full-month December reading on expected economic conditions recovered
its November decline with a 3.6% increase to the highest level since
September. The outlook for business conditions during the next twelve
months improved sharply and recovered most of November's decline but
the expected business conditions during the next five years fell and
expected personal finances advanced just modestly. All three of these
readings recently have been flat after sharp improvement early this
year.
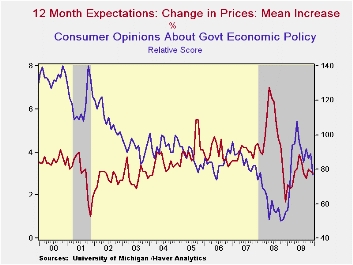 Expected
price inflation during the next year was roughly steady
m/m at 3.0% but it was up from last December's reading of
1.7%. Respondents' view of government policy, which may
eventually influence economic expectations, fell sharply m/m to the
lowest level since February. Sixteen percent of respondent thought that
a good job was being done by government versus 39% who thought a poor
job was being done.
Expected
price inflation during the next year was roughly steady
m/m at 3.0% but it was up from last December's reading of
1.7%. Respondents' view of government policy, which may
eventually influence economic expectations, fell sharply m/m to the
lowest level since February. Sixteen percent of respondent thought that
a good job was being done by government versus 39% who thought a poor
job was being done.
The Reuters/University of Michigan survey data are not seasonally adjusted. The reading is based on telephone interviews with about 500 households at month-end. These mid-month results are based on about 320 interviews. The summary indexes are in Haver's USECON database with details in the proprietary UMSCA database.
Inflation Expectations and the Risk of Deflation from the Federal Reserve Bank of San Francisco is available here.
| University of Michigan | December | Mid-December | November | October | Dec y/y | 2009 | 2008 | 2007 |
|---|---|---|---|---|---|---|---|---|
| Consumer Sentiment | 72.5 | 73.4 | 67.4 | 70.6 | 20.6% | 66.3 | 63.8 | 85.6 |
| Current Conditions | 78.0 | 79.1 | 68.8 | 73.7 | 12.2 | 69.6 | 73.7 | 101.2 |
| Expectations | 68.9 | 69.7 | 66.5 | 68.6 | 27.6 | 64.1 | 57.3 | 75.6 |
U.S. New Home Sales Fall Sharply
by Tom Moeller Deecember 23, 2009
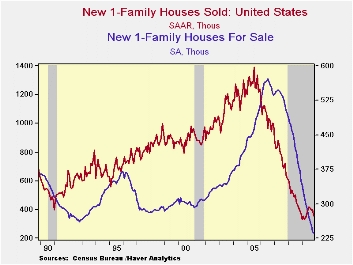 Conflicting
signals have been flashed regarding homes sales last month. In contrast
to yesterday's report that existing home sales rose, today the Commerce
Department reported that new home sales fell by 11.3% m/m to 355,000,
the lowest level since April. Nevertheless, near term home sales should
be helped by the recent extension of the Federal government's tax
credit which now it is for all home buyers and not just first-time
purchases. The November sales figure fell well short of Consensus
expectations for 439,000 sales.
Conflicting
signals have been flashed regarding homes sales last month. In contrast
to yesterday's report that existing home sales rose, today the Commerce
Department reported that new home sales fell by 11.3% m/m to 355,000,
the lowest level since April. Nevertheless, near term home sales should
be helped by the recent extension of the Federal government's tax
credit which now it is for all home buyers and not just first-time
purchases. The November sales figure fell well short of Consensus
expectations for 439,000 sales.
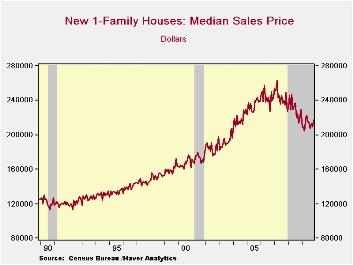
 Home
prices firmed
during November though the October figure was revised down. The median
price of a new single-family home rose to $217,400 which was the
highest level since May. The increase pared the y/y decline to 1.9%
from its worst of -14.5% this past February. The average new home price
of $280,300 was off 3.4% y/y.
Home
prices firmed
during November though the October figure was revised down. The median
price of a new single-family home rose to $217,400 which was the
highest level since May. The increase pared the y/y decline to 1.9%
from its worst of -14.5% this past February. The average new home price
of $280,300 was off 3.4% y/y.
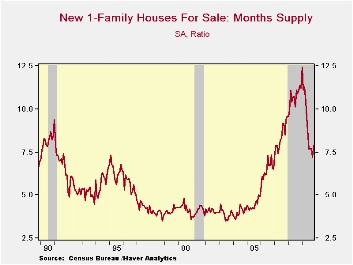
 Price
discounts, higher sales
and much lower housing starts have combined to lower the overhang of
unsold homes by more than one-third y/y to the overhang lowest level
since the early-1970s. The months' supply of unsold homes rose
moderately to 7.9 months but remained down from the high of 12.4 months
in January. The figure was the lowest since May 2007.
Price
discounts, higher sales
and much lower housing starts have combined to lower the overhang of
unsold homes by more than one-third y/y to the overhang lowest level
since the early-1970s. The months' supply of unsold homes rose
moderately to 7.9 months but remained down from the high of 12.4 months
in January. The figure was the lowest since May 2007.
Recent Developments in Mortgage Finance from the Federal Reserve Bank of San Francisco can be found here.
| US New Homes | November | October | September | Y/Y | 2008 | 2007 | 2006 |
|---|---|---|---|---|---|---|---|
| Total Sales (SAAR, 000s) | 355 | 400 | 393 | -9.0% | 481 | 769 | 1,049 |
| Northeast | 29 | 30 | 36 | -23.7 | 35 | 64 | 64 |
| Midwest | 68 | 56 | 68 | 23.6 | 69 | 118 | 161 |
| South | 179 | 227 | 196 | -14.8 | 264 | 409 | 559 |
| West | 79 | 87 | 93 | -9.2 | 113 | 178 | 266 |
| Median Price (NSA, $) | 217,400 | 209,400 | 213,500 | -1.9 | 230,408 | 243,742 | 243,067 |
Italy's Consumer Confidence Lifts Spirits For Christmas
Oh Come Ye Faithful...
by Tom Moeller December 23, 2009
Confidence rose again in December for Italian consumers making
the string of rises two months long. Still, the overall situation
deteriorated by one point to a -57 reading in December leaving the
current situation in the 68th percentile of its range.
The outlook for the overall situation also backtracked
dropping by 5 points month to month. Unemployment expectations rose and
now reside on the top 5% of their range.
The outlook for current savings backtracked but the outlook
for future savings rose sharply in the month.
The current environment for major purchase was sharply better
with its index rising to -38 from -43 and moving up to the 59th
percentile of its range.
Clearly the Italian consumer still feels pressured. The rise
in confidence is a good development despite backtracking in some key
components.
Italy still has a long way to go to cement any notion of
stability.
| Since Jan 1992 Rank | |||||||
| Dec-09 | Nov-09 | Oct-09 | Sep-09 | Percentile | Rank | percentile | |
| Consumer Confidence | 113.7 | 112.8 | 111.7 | 113.6 | 60.1 | 76 | 64.3% |
| Last 12 months | |||||||
| OVERALL SITUATION | -57 | -56 | -58 | -58 | 72.0 | 68 | 68.1% |
| PRICE TRENDS | -41 | -39 | -40.5 | -42 | 13.6 | 207 | 2.8% |
| Next 12months | |||||||
| OVERALL SITUATION | -1 | 4 | -2 | 5 | 60.3 | 109 | 48.8% |
| PRICE TRENDS | 8.5 | 8 | 7 | 9.5 | 17.3 | 96 | 54.9% |
| UNEMPLOYMENT | 16 | 15 | 19 | 17 | 67.6 | 10 | 95.3% |
| HOUSEHOLD BUDGET | 1 | 3 | 5 | 6 | 17.8 | 199 | 6.6% |
| HOUSEHOLD FIN SITUATION | |||||||
| Last 12 months | -37 | -36 | -35 | -33 | 38.8 | 129 | 39.4% |
| Next12 months | -3 | -2 | -4 | -1 | 65.3 | 102 | 52.1% |
| HOUSEHOLD SAVINGS | |||||||
| Current | 73 | 77 | 79 | 80 | 88.3 | 6 | 97.2% |
| Future | -20 | -29 | -30 | -16 | 62.2 | 124 | 41.8% |
| MAJOR Purchases | |||||||
| Current | -38 | -43 | -38 | -40 | 47.3 | 87 | 59.2% |
| Total number of months: 213 | |||||||

Tom Moeller
AuthorMore in Author Profile »Prior to joining Haver Analytics in 2000, Mr. Moeller worked as the Economist at Chancellor Capital Management from 1985 to 1999. There, he developed comprehensive economic forecasts and interpreted economic data for equity and fixed income portfolio managers. Also at Chancellor, Mr. Moeller worked as an equity analyst and was responsible for researching and rating companies in the economically sensitive automobile and housing industries for investment in Chancellor’s equity portfolio. Prior to joining Chancellor, Mr. Moeller was an Economist at Citibank from 1979 to 1984. He also analyzed pricing behavior in the metals industry for the Council on Wage and Price Stability in Washington, D.C. In 1999, Mr. Moeller received the award for most accurate forecast from the Forecasters' Club of New York. From 1990 to 1992 he was President of the New York Association for Business Economists. Mr. Moeller earned an M.B.A. in Finance from Fordham University, where he graduated in 1987. He holds a Bachelor of Arts in Economics from George Washington University.
More Economy in Brief


