 Global| Jan 15 2009
U.S. December PPI Fell Again; 2008Strength in Pricing Abruptly Ends
by:Tom Moeller
|in:Economy in Brief
Summary
U.S. producer prices for finished goods fell 1.9% last month versus expectations for a 2.0% drop. The decline was the fifth in as many months. Nevertheless, 2008 was a year when price increases as a whole were stronger than during [...]
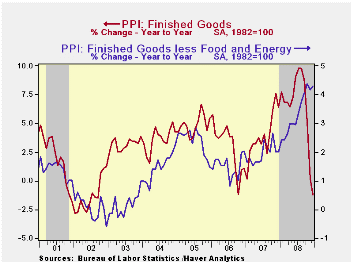 U.S.
producer prices for finished goods fell 1.9% last month versus
expectations for a 2.0% drop. The decline was the fifth in as many
months. Nevertheless, 2008 was a year when price increases as a whole
were stronger than during 2007. The 6.3% increase in the overall
Producer Price Index compared to a 3.9% rise one year earlier and it
was the firmest since 1991. Several month-to-month increases,
which exceeded 1.0% early in 2008, were responsible for that lift.
U.S.
producer prices for finished goods fell 1.9% last month versus
expectations for a 2.0% drop. The decline was the fifth in as many
months. Nevertheless, 2008 was a year when price increases as a whole
were stronger than during 2007. The 6.3% increase in the overall
Producer Price Index compared to a 3.9% rise one year earlier and it
was the firmest since 1991. Several month-to-month increases,
which exceeded 1.0% early in 2008, were responsible for that lift.
Gains in energy prices were responsible for much of the acceleration in the PPI last year. Though they fell 9.3% last month, down for the fifth consecutive month, for all of 2008 they rose 14.0% and that was double the 2007 increase. December-to-December energy prices fell 21.2%. That decline was enough to lower the level of finished energy prices in December to that of mid-2005. Therefore, much more sanguine news on pricing is in the cards for this year.
Finished consumer food prices also eased during the last three months and in December they fell 1.5%. That lowered the December-to-December increase to a moderate 3.8%. Nevertheless, for all of last year food prices rose a strong 6.9% which was about the gain they posted in 2007. Large monthly increases early in the year were responsible for that lift and they were led by a 6.5% rise in meat prices, which was double the 2007 rise, and a 34.5% rise in pasta product prices.
 Less food
& energy,
prices also firmed in 2008. First, the December increase of 0.2% was
double Consensus expectations. That gain followed a slim 0.1% increase
one month earlier but these followed four consecutive monthly increases
between 0.4% and 0.6%. The y/y rise in the core PPI of 4.3% was nearly
the strongest since late-1989. Prices of core finished consumer goods
rose 0.3% last month and that ended a year when they increased 4.5%
from December-to-December. The gain was the strongest since 1989.
Durable consumer goods prices jumped 0.5% last month and were up 3.2%
y/y. Appliance prices jumped 3.8% y/y, their strongest since 1989,
while core nondurable goods prices strengthened to a 5.6% y/y increase,
also the fastest rise since early 1999. In addition, prices
for capital equipment firmed and rose 4.0%, again the strongest since
1989.
Less food
& energy,
prices also firmed in 2008. First, the December increase of 0.2% was
double Consensus expectations. That gain followed a slim 0.1% increase
one month earlier but these followed four consecutive monthly increases
between 0.4% and 0.6%. The y/y rise in the core PPI of 4.3% was nearly
the strongest since late-1989. Prices of core finished consumer goods
rose 0.3% last month and that ended a year when they increased 4.5%
from December-to-December. The gain was the strongest since 1989.
Durable consumer goods prices jumped 0.5% last month and were up 3.2%
y/y. Appliance prices jumped 3.8% y/y, their strongest since 1989,
while core nondurable goods prices strengthened to a 5.6% y/y increase,
also the fastest rise since early 1999. In addition, prices
for capital equipment firmed and rose 4.0%, again the strongest since
1989.
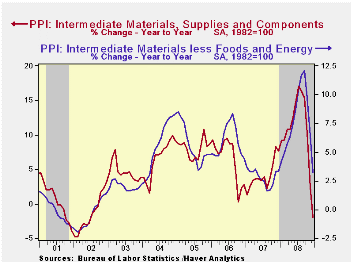
Lower prices for intermediate goods may portend easier price
gains in finished goods prices this year. 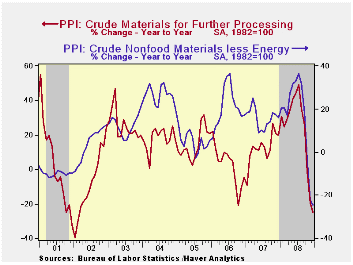 They fell 4.2% last
month and repeating their decline in November. Energy prices
dropped 9.5% (-20.4% y/y). Excluding food & energy,
prices fell for the third consecutive month.
They fell 4.2% last
month and repeating their decline in November. Energy prices
dropped 9.5% (-20.4% y/y). Excluding food & energy,
prices fell for the third consecutive month.
The crude materials PPI was down sharply for the fifth straight month. Energy prices led the fall with a 6.0% (-33.4% y/y) drop and crude food prices fell 5.3% (-13.9% y/y). Less food & energy, crude prices fell 2.2% with the recent drop in commodity prices.
The latest Beige Book from the Federal Reserve which covers regional economic conditions can be found here.
| Producer Price Index (%) | December | November | Y/Y | 2008 | 2007 | 2006 |
|---|---|---|---|---|---|---|
| Finished Goods | -1.9 | -2.2 | -1.2 | 6.3 | 3.9 | 3.0 |
| Core | 0.2 | 0.1 | 4.3 | 3.4 | 1.9 | 1.5 |
| Intermediate Goods | -4.2 | -4.3 | -2.0 | 10.5 | 4.1 | 6.4 |
| Core | -3.0 | -2.3 | 3.2 | 7.6 | 2.8 | 6.0 |
| Crude Goods | -5.3 | -12.5 | -24.8 | 21.5 | 12.1 | 1.4 |
| Core | -2.2 | -20.4 | -24.5 | 15.2 | 15.6 | 20.8 |
U.S. Weekly Claims For Jobless Insurance Back Up
by Tom Moeller January 15, 2009
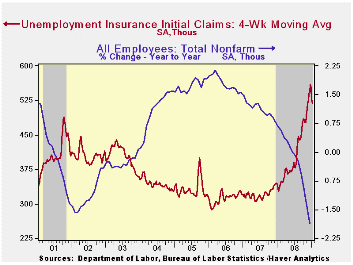
Initial claims for unemployment insurance rose last week and recovered a piece of the decline in earlier weeks. The 54,000 week-to-week increase to 524,000 followed declines of 21,000 (slightly revised) and 98,000 during the prior two weeks. These latter declines were widely attributed to aberrant seasonal factors, although a problem near this magnitude has not been observed since 2001. The latest increase exceeded Consensus expectations for a rise to 501,000.
The Labor Department indicated that the largest increases in
initial claims for the week ending January 3 were in New York
(+24,465), North Carolina (+19,749), Georgia (+18,308), South Carolina
(+14,905), and Virginia (+7,362), while the largest decreases were in
California (-14,796), Kansas (-13,313), Michigan (-11,956), Illinois
(-9,727), and Ohio (-7,499).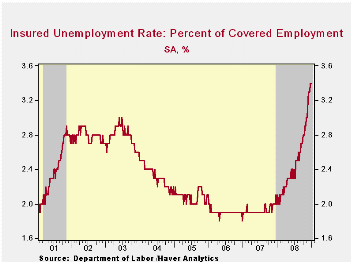
Continuing claims for unemployment insurance during the week of January 3 fell 115,000 and that reversed roughly half of the prior week's increase. The four-week average of continuing claims rose 27,500 to 4,500,000. Continuing claims provide some indication of workers' ability to find employment and they lag the initial claims figures by one week.
The insured rate of unemployment remained stable for the third week at this cycle's high of 3.4%. The highest insured unemployment rates in the week ending December 27 were in Oregon (7.4 percent), Michigan (6.6), Idaho (6.3), Wisconsin (6.0), South Carolina (5.4), Arkansas (5.3), Nevada (5.2), Pennsylvania (5.2), Indiana (5.1), and Montana (5.1).
Three Funerals and a Wedding from the Federal Reserve Bank of St. Louis is available here.
The Current Recession: How Bad Is It? also from the Federal Reserve Bank of St. Louis can be found here.
| Unemployment Insurance (000s) | 01/10/09 | 01/03/09 | 12/27/08 | Y/Y | 2008 | 2007 | 2006 |
|---|---|---|---|---|---|---|---|
| Initial Claims | 524 | 470 | 491 | 66.3% | 420 | 321 | 313 |
| Continuing Claims | -- | 4,497 | 4,612 | 64.5% | 3,342 | 2,552 | 2,459 |
Philadelphia Fed Index Improved Slightly But Still Low
by Tom Moeller January 15, 2009
The Philadelphia Federal Reserve Bank indicated that its
January Index of General Business conditions in the manufacturing
sector rose slightly from the recent monthly lows. However, the index
at -24.3 this month was still only slightly better than the lows of the
prior two recessions. A weaker reading of -35 had been expected for
this month.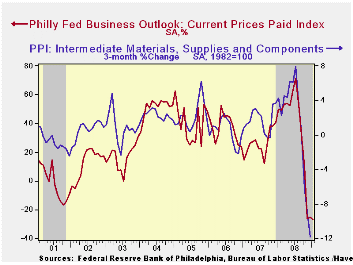
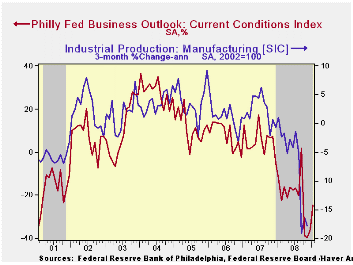
During the last ten years there has been a 71% correlation between the level of the Philadelphia Fed Business Conditions Index and the three-month growth in factory sector industrial production. There has been a 54% correlation with q/q growth in real GDP.
The Philadelphia Fed constructs a diffusion index for total business activity and each of the sub-indexes. The business conditions index reflects a separate survey question.
The employment index weakened sharply to the lowest level since the recession of 1975. A record forty eight percent of respondents expected to reduce employment levels while only nine percent expected to raise them. During the last ten years there has been a 79% correlation between the index level and the m/m change in manufacturing sector payrolls.
The new orders index ticked up slightly to a reading of -22.3 and the shipments index also recovered all of its sharp December decline.
The prices paid index fell, for the third month, to a record low. During the last ten years there has been a 69% correlation between the prices paid index and the three-month growth in the intermediate goods PPI. There has been an 82% correlation with the change in core intermediate goods prices. Just eleven percent of respondents increased prices this month versus thirty eight percent that lowered them.
The separate index of expected business conditions in six months rose slightly to its highest level since September. The expectations index for new orders led the improvement but the expectations index for employment fell to a record low.
The Philadelphia Fed figures can be found in Haver's SURVEYS database.
The latest Business Outlook Survey from the Federal Reserve Bank of Philadelphia can be found here.
The Fed, Liquidity, and Credit Allocation from the Federal Reserve Bank of St. Louis can be found here.
| Philadelphia Fed (%) | January | December | January '08 | 2008 | 2007 | 2006 |
|---|---|---|---|---|---|---|
| General Activity Index | -24.3 | -36.1 | -12.0 | -21.3 | 5.0 | 8.0 |
| Prices Paid Index | -27.0 | -25.5 | 49.8 | 36.4 | 26.3 | 36.7 |
Core Inflation in the EMU and in the US Falling Together...at Last
by Brusca Robert January 15, 2009
The EMU inflation picture was finalized with headline
inflation dropping by 0.3% in the month and up by 1.6% Yr/Yr as had
been reported in the flash release. With today’s report we get the
detail behind the headline.
Inflation is falling sharply for goods as the progressive
growth rates show over shorter horizons the pace of declines getting
greater. That is not true of services, however, there inflation is
stuck and has even notched up over three-months. Still, for the overall
and core rates inflation is decelerating and for the key headline
series for which the ECB imposes a ceiling, the pace of inflation is
now below that ceiling for 3mo, 6-mo and 12-mo inflation calculations,
but most importantly for the 12-mo series that the ECB emphasizes.
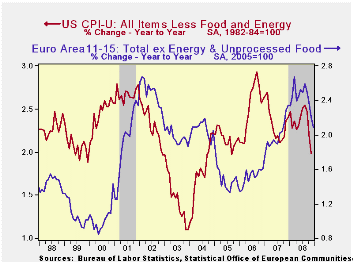
Still we present a graph above showing the core rate compared
with that same rate in the US. For Core inflation the two rates have
had different cycles for this two economic groups and some considerable
divergence in recent years. But now the core, which is as good a short
hand as we have for TREND inflation, is showing a sharp decline for
inflation in the US and well as in EMU.
The most recent synchronous declines in inflation came in 2002
and 2003 with another minor episode in 2005.
Since 2004 US and EMU inflation trends have been doing
different things. Over this period EMU inflation has accelerated until
the recent peaking and deceleration. In the US inflation has mostly
moved sideways during this period but with some considerable
volatility. US Core inflation rose from early through late 2006 before
oscillating in range- a range from which it is now declining. As a
result the current US core inflation rate is the lowest realm we have
seen since mid 2004. For EMU core inflation is only back to late 2007
levels. Even a casual look at the chart and the table above shows why
some ECB hawks have been reluctant to cut rates. EMU core inflation has
been much more in the mode of accelerating than has core inflation in
the US. Even as the headline rate plummets, EMU service sector
inflation is showing some unexpected - and sometimes unrecognized -
resilience. So despite the EMU rate cut we can only wonder how much
these trends will limit flexibility in the ECB monetary policymaking in
the months ahead..
| Trends in HICP | |||||||
|---|---|---|---|---|---|---|---|
| % mo/mo | % saar | ||||||
| Dec-08 | Nov-08 | Oct-08 | 3-Mo | 6-Mo | 12-Mo | Yr Ago | |
| EMU-13 | -0.3% | -0.3% | 0.0% | -2.6% | -0.9% | 1.6% | 3.1% |
| Core | 0.1% | 0.1% | 0.2% | 1.7% | 1.8% | 2.1% | 2.3% |
| Goods | -0.8% | -0.8% | 0.0% | -6.1% | -4.1% | 0.9% | 3.4% |
| Services | 0.8% | -0.1% | 0.1% | 3.3% | 2.6% | 2.6% | 2.5% |
| HICP | |||||||
| Germany | -0.5% | -0.1% | -0.3% | -3.3% | -0.9% | 1.1% | 3.1% |
| France | -0.3% | -0.4% | 0.1% | -2.5% | -1.6% | 1.2% | 2.8% |
| Italy | 0.0% | -0.5% | 0.3% | -0.7% | 0.2% | 2.4% | 2.8% |
| Spain | -0.4% | -0.4% | -0.3% | -4.2% | -1.5% | 1.4% | 4.3% |
| Core excl Food Energy Alcohol | |||||||
| Germany | 0.3% | 0.1% | -0.1% | 1.1% | 1.7% | 1.2% | 2.5% |
| Italy | 0.3% | 0.0% | 0.5% | 3.0% | 2.5% | 2.8% | 2.3% |
| UK | #N/A | 0.2% | 0.0% | #N/A | #N/A | #N/A | 1.8% |
| Spain | 0.1% | 0.1% | 0.1% | 1.3% | 2.2% | 2.4% | 3.4% |

Tom Moeller
AuthorMore in Author Profile »Prior to joining Haver Analytics in 2000, Mr. Moeller worked as the Economist at Chancellor Capital Management from 1985 to 1999. There, he developed comprehensive economic forecasts and interpreted economic data for equity and fixed income portfolio managers. Also at Chancellor, Mr. Moeller worked as an equity analyst and was responsible for researching and rating companies in the economically sensitive automobile and housing industries for investment in Chancellor’s equity portfolio. Prior to joining Chancellor, Mr. Moeller was an Economist at Citibank from 1979 to 1984. He also analyzed pricing behavior in the metals industry for the Council on Wage and Price Stability in Washington, D.C. In 1999, Mr. Moeller received the award for most accurate forecast from the Forecasters' Club of New York. From 1990 to 1992 he was President of the New York Association for Business Economists. Mr. Moeller earned an M.B.A. in Finance from Fordham University, where he graduated in 1987. He holds a Bachelor of Arts in Economics from George Washington University.
More Economy in Brief


