 Global| Feb 02 2009
U.S. December Income, Consumption& Prices Fell While Savings Rose
by:Tom Moeller
|in:Economy in Brief
Summary
The personal income & outlays report for the end of 2008 contained news of difficult times for the "front-end" of the U.S. economy. To start, personal income fell for the third straight month. The 0.2% December decline was a bit less- [...]
The personal income & outlays report for the end of 2008 contained news of difficult times for the "front-end" of the U.S. economy. To start, personal income fell for the third straight month. The 0.2% December decline was a bit less-than-expected and it lowered the gain for the full year to 3.7% which was the weakest since 2003. The year ended with December-to-December growth in income of just 1.4% and a three-month drop of 2.6% (AR).
A 0.3% decline in wages & salaries was in the forefront of that income weakness as employment levels declined. Wages over the last three months were down at a 2.1%rate and up just 2.8% for the full year, half that during 2007. Factory sector wages suffered the worst of the shortfall with an 8.2% three-month rate of decline. In addition, service sector wages fell at a 1.5% rate during those three months which was their weakest performance since the recession of 2001.
Lower interest rates caused the seventh straight monthly
decline in interest income. The -7.2% y/y growth rate was eclipsed,
however, by the 22.1% rate of decline during the last three months.
Dividend income also fell at a 5.9% rate during that three month period
as corporate profits fell.
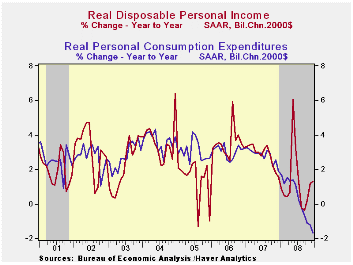
Disposable personal income dropped last month for the sixth month in the last seven to lower the three-month change to -2.3%. Thanks to falling energy prices and weaker pricing power generally, real disposable income growth actually increased by a strong 6.7% (1.3% y/y).
Personal consumption suffered heavily from across-the-board
weakness. The December decline was the sixth in a row. While the
three-month rate of growth was an abysmal -11.2% (AR), the change in
real terms was little better. Real personal consumption
expenditures fell 0.5% last month and at a 3.1% during the
last three.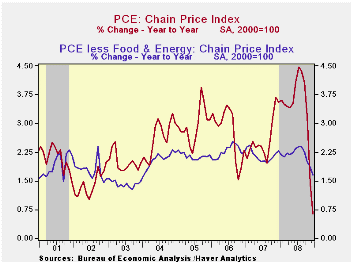
Real spending on discretionary items was notably weak. Motor vehicle & parts purchases fell 0.4% in December and the three-month annual growth rate amounted to -33.1%. Real spending on household furniture & appliances fell at a lesser 4.7% rate while real spending on apparel dropped at a 2.7% rate since September. These and other detailed spending figures are available in Haver's USNA database.
The silver lining of this weakness in spending is while it reflects weakened income growth, it also produced a rise in the level of savings. The personal savings rate rose last month to 3.6 versus an average of 1.7% for the year, which was the highest since 2004.
Declines in spending caused pricing power to evaporate. The PCE chain price index fell 0.5% last month with lower petroleum prices. Core pricing power, however, was additionally under pressure. The 0.0% December downtick in the core PCE price index about matched expectations and it was the third such consecutive decline. It lowered the three-month change in core pricing to -0.1% which was its weakest since the recession of 2001.
The Federal Reserve Board published a policy that was adopted to help avoid preventable foreclosures on certain residential mortgage assets. The Fed's release can be found here.
| Disposition of Personal Income (%) | December | November | Y/Y | 2008 | 2007 | 2006 |
|---|---|---|---|---|---|---|
| Personal Income | -0.2 | -0.4 | 1.4 | 3.7 | 6.1 | 7.1 |
| Disposable Personal Income | -0.2 | -0.3 | 1.9 | 4.6 | 5.5 | 6.4 |
| Personal Consumption | -1.0 | -0.8 | -1.1 | 3.6 | 5.5 | 5.9 |
| Saving Rate | 3.6 | 2.8 | 0.4 (Dec. 08) | 1.7 | 0.5 | 0.7 |
| PCE Chain Price Index | -0.5 | -1.1 | 0.6 | 3.3 | 2.6 | 2.8 |
| Less food & energy | -0.0 | -0.0 | 1.7 | 2.2 | 2.2 | 2.3 |
ISM Index Improved Slightly From Historic Low
by Tom Moeller February 2, 2009
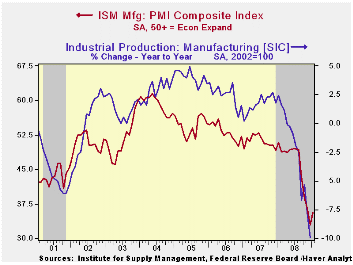
The Institute for Supply Management (ISM) reported that its January Composite Index of Activity in the manufacturing sector improved slightly to 35.6 from it's December low of 32.4. The latest was still near the lowest level since the recession year of 1980. The break-even level for this diffusion index of factory sector activity is a level of 50.you
During the last twenty years there has been a 64% correlation between the level of the Composite Index and the three-month growth in factory sector industrial production.
It is appropriate to correlate the ISM index level
with factory sector growth because the ISM index
is a diffusion index. It measures growth by using all of the positive
changes in activity added to one half of the zero change in activity
measures.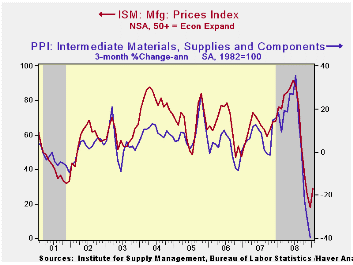
The separate index of prices paid also improved moderately to 29.0. That, however, was not much above the lowest level since 1949. During the last twenty years there has been a 79% correlation between the price index and the three-month change in the PPI for intermediate goods.
The latest increase in the composite index recouped only a bit of the declines during the prior five months. That suggests the recent 10% rate of decline in industrial output will continue.
The new orders index during January improved slightly as 15% of survey participants reported higher orders but 52% reported that orders fell. The export order index improved, but only at the margin as economic weakness outside of the U.S. continued. It was still near the lowest level in this index's short twenty year history. During the last ten years there has been a 53% correlation between the index and the q/q change in real exports of goods in the GDP accounts.
| ISM Mfg | January | December | January '08 | 2008 | 2007 | 2006 |
|---|---|---|---|---|---|---|
| Composite Index | 35.6 | 32.9 | 50.8 | 45.5 | 51.1 | 53.1 |
| New Orders Index | 33.2 | 23.1 | 48.9 | 42.1 | 54.3 | 55.4 |
| Employment Index | 29.9 | 29.9 | 47.9 | 43.2 | 50.5 | 51.7 |
| Prices Paid Index (NSA) | 29.0 | 18.0 | 76.0 | 66.5 | 64.6 | 65.0 |
MFG PMIs Stop Their Descent
by Robert Brusca February 2, 2009
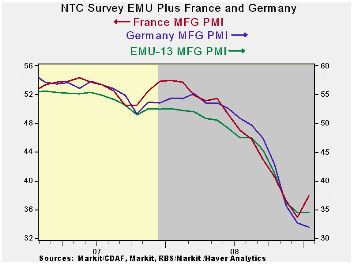
The PMIs for Europe reside very near the bottom of their
respective ranges. Generally the readings are bottom 10% of range or
less across large EMU members and the UK. Germany is now one of the
relative weakest countries on this measure – it is at its range low
point. Germany is one of four countries to see its MFG PMI drop further
in January.
PMIs: what they are:
PMIs are super sensitive gauges of activity. And they usually detect
turning points in a sector before more convention indicators do. The
MFG PMIs have only just stopped their declining ways for the EMU
region; for several countries the bottom has not yet been hit (as far
as we know). Even for those that have rebounded this month we do not
know with any degree of confidence that they have firmly put their past
low point behind them for the duration of this cycle.
Too soon for the end?
It is too soon to call this a turning point signal. But the first step
to getting to a turning point is to build a base that signals that the
PACE OF decline has bottomed out. Remember that these are diffusion
indices and even if they move ‘sideways’, as long as the value is below
50 it is signaling further declines in the sector they measure. Also
recall that PMIs are formally indicators of the breadth of a decline or
the breadth of an increase in industry; they are not indicators of
STRENGTH.
What about the beginning of the end?
It may also be too soon to look even for bottoming, but it may also be
that such a bottoming process has begun. The levels of the PMIs are
extremely low, and that is the sort of pace we would expect a true
stabilization process to begin at in a cycle such as this. We know MFG
is hard-hit so unless the PMIs reached very low readings we would
continue to think that worse results would still lay ahead. Now that a
first criterion for stabilization has been met (new all-time lows or
readings near to that) we can look for a second, namely a period of
time in which the PMIs either make modest gains or establish a base by
moving sideways. The final step would be for them to rise and
eventually to poke their heads above the level of 50. That one is still
quite a way off.
| NTC/Markit MFG Indices | |||||||
|---|---|---|---|---|---|---|---|
| Jan-09 | Dec-08 | Nov-08 | 3Mo | 6Mo | 12Mo | Percentile | |
| Euro-13 | 34.42 | 33.88 | 35.58 | 34.63 | 39.58 | 44.98 | 2.1% |
| Germany | 31.96 | 32.66 | 35.66 | 33.43 | 40.03 | 46.69 | 0.0% |
| France | 37.90 | 34.91 | 37.28 | 36.70 | 39.91 | 45.34 | 10.1% |
| Italy | 36.06 | 35.54 | 34.95 | 35.52 | 39.62 | 43.86 | 4.9% |
| Spain | 31.51 | 28.49 | 29.42 | 29.81 | 34.12 | 38.89 | 10.5% |
| Austria | 33.12 | 35.01 | 38.26 | 35.46 | 40.74 | 45.43 | 0.0% |
| Greece | 39.98 | 40.96 | 42.25 | 41.06 | 45.77 | 49.44 | 0.0% |
| Ireland | 38.94 | 37.87 | 37.10 | 37.97 | 40.36 | 43.00 | 10.1% |
| Netherlands | 36.29 | 38.42 | 38.71 | 37.81 | 42.80 | 46.99 | 0.0% |
| EU | |||||||
| UK | 35.78 | 34.91 | 34.48 | 35.06 | 38.64 | 43.65 | 6.0% |
| percentile is over range since March 2000 | |||||||
U.S. Construction Spending Fell For Second Year
by Tom Moeller February 2, 2009
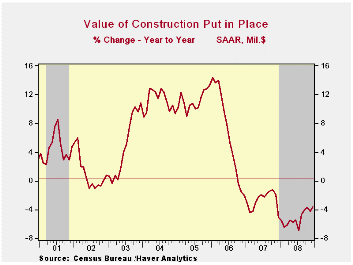
The value of construction put in place during December dropped
another 1.4%. The decline followed a 1.2% November drop which was
double the decline originally estimated. These declines pulled overall
construction down 5.2% for the full year 2008 which was the weakest
performance since 1991. It followed a 2.7% decline during 2007. Last
month's decline about matched Consensus expectations.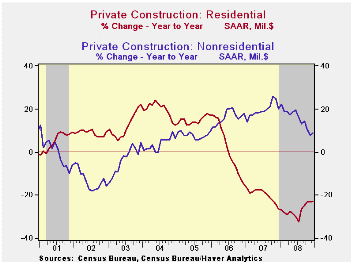
Residential building activity led the latest monthly decline with a 3.2% drop which pulled 2008 activity off by roughly one-quarter from the full year from 2007. That was a record decline for the series which extends back to 1965. Single-family construction activity fell 8.1% last month after a 6.1% November drop. It pulled the full-year level down 39.0% after a 26.8% drop during 2007. Building activity on multi-family units also fell hard. The 3.2% December decline lowered activity by 8.5% for the full year, about the same as the 2007 drop. Spending on improvements, however, recouped a 2.0% November fall but still ended the year posting a 7.2% decline.
During the last twenty years there has been an 84% correlation between the q/q change in the value of residential building and its contribution to growth in real GDP.
The value of nonresidential building activity has remained
firm relative to the residential sector. Though the 0.4% December slip
was the fifth in the last six months, activity rose 15.3% for the full
year or about the same as during 2007. Spending on office construction
rose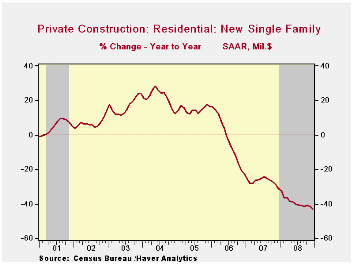 8.3% for the year, but that
was roughly half the growth during the prior three years. Building in
the multi-retail sector, however, fell 3.8% for the year after a 17.0%
gain during 2007 and a 28.3% surge during 2006. Spending on health care
facilities rose 8.1% for the year, about as it has since 2003. Building
activity of educational facilities rose 10.2% last year after a 22.9%
2007 gain
8.3% for the year, but that
was roughly half the growth during the prior three years. Building in
the multi-retail sector, however, fell 3.8% for the year after a 17.0%
gain during 2007 and a 28.3% surge during 2006. Spending on health care
facilities rose 8.1% for the year, about as it has since 2003. Building
activity of educational facilities rose 10.2% last year after a 22.9%
2007 gain
Public construction fell 0.8% in December. But for the year activity rose a firm 7.1% after a 12.3% 2007 rise. Office building led the gain with 30.8% rise for the full year while the value of spending on educational facilities rose 7.8%. Spending on highways & streets rose 5.1% the full year, about as it did in 2007. The value of construction on highways & streets is roughly one-third of the value of total public construction spending.
The more detailed categories of construction represent the Census Bureau’s reclassification of construction activity into end-use groups. Finer detail is available for many of the categories; for instance, commercial construction is shown for automotive dealers and parking facilities, drugstores, building supply stores, and both commercial warehouses and mini-storage facilities. Note that start dates vary for some seasonally adjusted line items in 2000 and 2002, and that constant-dollar data are no longer computed.
| Construction (%) | December | November | Y/Y | 2008 | 2007 | 2006 |
|---|---|---|---|---|---|---|
| Total | -1.4 | -1.2 | -3.6 | -5.2 | -2.7 | 6.3 |
| Private | -1.7 | -2.3 | -7.6 | -9.3 | -6.9 | 5.5 |
| Residential | -3.2 | -4.1 | -22.9 | -27.1 | -19.8 | 1.0 |
| Nonresidential | -0.4 | -0.8 | 8.9 | 15.3 | 19.6 | 16.2 |
| Public | -0.8 | 1.2 | 7.0 | 7.1 | 12.3 | 9.3 |
South Korean Exports Plummet: Sharp Fall in Exports to Pacific Rim
by Louise Curley February 2, 2009
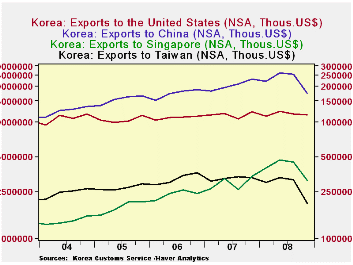 South Korea announced today
that its January exports fell
32.7% below a year ago, the largest year to year percentage decline on
record. Except for September 2007, when exports fell 1.1%, Korea's
exports have shown double digit year to year percent increases in
South Korea announced today
that its January exports fell
32.7% below a year ago, the largest year to year percentage decline on
record. Except for September 2007, when exports fell 1.1%, Korea's
exports have shown double digit year to year percent increases in
 practically every month
since July 2002 until November of last year
when double digit declines began to appear, as shown in the first chart.
practically every month
since July 2002 until November of last year
when double digit declines began to appear, as shown in the first chart.
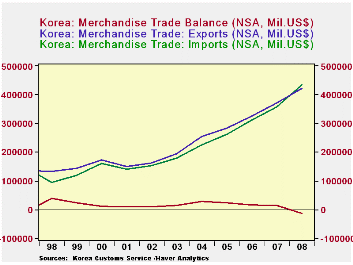
Imports have also declined, but at a somewhat slower pace with
the results that the ten year stretch of South Korean trade surpluses
begun in 1998 has come to a stop. 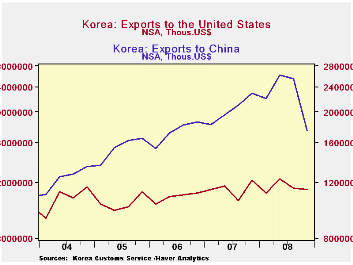 There was a $12.7 billion trade
deficit in 2008, compared with a surplus of $14.6 billion in 2007.
Annual data for exports, imports and balances of trade from 1998
through 2008 are shown in the second chart.
There was a $12.7 billion trade
deficit in 2008, compared with a surplus of $14.6 billion in 2007.
Annual data for exports, imports and balances of trade from 1998
through 2008 are shown in the second chart.
| South Korea | Jan 09 | Dec 08 | Nov 08 | Oct 08 | Sep 08 | Aug 08 | July 08 | 2008 | 2007 |
|---|---|---|---|---|---|---|---|---|---|
| Exports (NSA, Bil US$) | 21.7 | 27.3 | 29.2 | 37.4 | 39.1 | 36.6 | 41.0 | 422.9 | 371.5 |
| Imports (NSA, Bil US$) | 24.7 | 26.8 | 28.9 | 35.8 | 39.4 | 40.1 | 43.7 | 435.6 | 356.9 |
| Balance (NSA, Bil US$) | -3.0 | 0.7 | 0.3 | 1.2 | -2.2 | -3.8 | -2.0 | -12.7 | 14.6 |
| Exports (Y/Y % Chg | -32.8 | -17.4 | -18.2 | 8.53 | 27.7 | 18.2 | 35.6 | 14.1 | 13.8 |
| Imports (Y/Y % Chg | -32.1 | -21.5 | -14.7 | 10.4 | 45.8 | 36.4 | 47.4 | 15.4 | 22.1 |
| Exports to US Y/Y % Chg | -- | -9.4 | -14.3 | 5.0 | 19.3 | 1.0 | 9.3 | 11.5 | 18.0 |
| To China Y/Y % Chg | -- | -36.4 | -33.7 | -3.5 | 15.0 | 19.3 | 30.1 | 3.2 | 10.6 |
| To Taiwan Y/Y % Chg | -- | -56.9 | -45.2 | -17.0 | 1.3 | -15.0 | -1.4 | -12.0 | 0.2 |
| To Malaysia Y/Y % Chg | -- | -30.5 | -21.4 | -24.8 | 8.2 | 10.8 | 27.6 | 1.6 | 9.1 |

Tom Moeller
AuthorMore in Author Profile »Prior to joining Haver Analytics in 2000, Mr. Moeller worked as the Economist at Chancellor Capital Management from 1985 to 1999. There, he developed comprehensive economic forecasts and interpreted economic data for equity and fixed income portfolio managers. Also at Chancellor, Mr. Moeller worked as an equity analyst and was responsible for researching and rating companies in the economically sensitive automobile and housing industries for investment in Chancellor’s equity portfolio. Prior to joining Chancellor, Mr. Moeller was an Economist at Citibank from 1979 to 1984. He also analyzed pricing behavior in the metals industry for the Council on Wage and Price Stability in Washington, D.C. In 1999, Mr. Moeller received the award for most accurate forecast from the Forecasters' Club of New York. From 1990 to 1992 he was President of the New York Association for Business Economists. Mr. Moeller earned an M.B.A. in Finance from Fordham University, where he graduated in 1987. He holds a Bachelor of Arts in Economics from George Washington University.
More Economy in Brief


