 Global| Mar 14 2008
U.S. CPI Total & Core Unchanged
by:Tom Moeller
|in:Economy in Brief
Summary
The consumer price index (CPI-U) was unchanged in February following two consecutive months of 0.4% increase. It compared to expectations for a 0.3% rise and was the weakest since prices were unchanged last August. A slight dip in the [...]
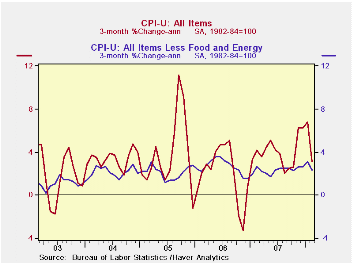
The consumer price index (CPI-U) was unchanged in February following two consecutive months of 0.4% increase. It compared to expectations for a 0.3% rise and was the weakest since prices were unchanged last August. A slight dip in the y/y rate of increase to 4.0% left it still at the second strongest growth rate since 2005.
Less food & energy, consumer prices
also were unchanged m/m after January's elevated 0.3% increase. That
also fell short of expectations for a 0.2% increase and it was the
weakest reading since November 2006. The lack of an increase brought
the y/y gain down to 2.3%, its lowest since last October. A
Comparison of Measures of Core Inflation from the Federal
Reserve Bank of New York can be found here.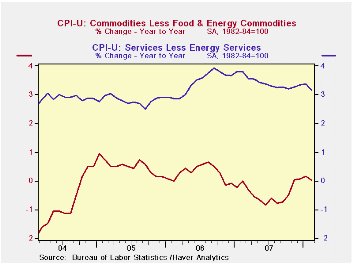
Inflation of food & beverage prices took a breather last month and dipped to 0.4% after a 0.7% January increase. It nevertheless left the y/y gain elevated at 4.6%, up from a 4.0% rate of increase last year. Prices for meats poultry & fish actually fell 0.1% m/m (4.7% y/y) after a 0.8% January pop and prices for fruits & vegetables also fell by 1.3% (+1.4% y/y) after the 2.2% rise during January. Cereal & bakery product prices, however, surged 1.8%. The y/y increase here of 6.6% was the strongest since 1990.
Energy prices prices also were tame last
month and posted a 0.5% decline. The drop owed to a 2.0% m/m decline in
gasoline prices but that still left them up 32.7% from twelve months
earlier. Moreover, the weekly data for this month already indicate that
the respite from price strength has ended. A 5.5% m/m rise in average
gasoline prices so far in March to $3.23 per gallon would be the
strongest since November. Also, it will add by itself 0.3% to the March
CPI increase. Prices for fuel oil & other fuels in February
backed off 1.3% (+33.0% y/y) after a strong 3.7% January surge. Natural
gas & electricity prices, however, worked the other way and
rose 1.7% (3.5% y/y).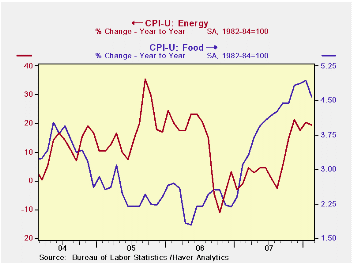
Core goods prices in February dipped 0.1%, the first m/m decline since last June. It reflected a 0.3% decline (-1.0% y/y) in apparel prices and no change (-0.6% y/y) in household furnishings & operations (-0.6% y/y). Prices for new & used motor vehicles also fell by 0.2% (0.0% y/y) during February.
Core services price inflation also took a breather in February and eased to 0.1%. Shelter prices, which constitute 33% of the total CPI, were unchanged (2.9% y/y). Owners equivalent rent of primary residence, a measure not equivalent to other house price measures, ticked up 0.1% (2.6% y/y). Medical care services prices also rose just 0.1% after a 0.6% January surge. Prices were up a strong 5.0% y/y after last year's 5.3% increase. Tuition costs rose 0.3% (5.5% y/y), about equal to the strong 5.6% gain during all of last year. Public transportation prices dipped 0.1% (+5.2% y/y).
Stable Prices, Stable Economy: Keeping Inflation in Check Must be No. 1 Goal of Monetary Policymakers from the Federal Reserve bank of St. Louis is available here.A Falling Dollar Raises Inflation in the Gulf also from the Federal Reserve Bank of St. Louis can be found here.
| Consumer Price Index (%) | February | January | December | Feb. Y/Y | 2007 | 2006 | 2005 |
|---|---|---|---|---|---|---|---|
| Total | 0.0 | 0.4 | 0.4 | 4.0 | 2.9 | 3.2 | 3.4 |
| Total less Food & Energy | 0.0 | 0.3 | 0.2 | 2.3 | 2.3 | 2.5 | 2.2 |
| Goods less Food & Energy | -0.1 | 0.2 | 0.0 | 0.0 | -0.4 | 0.2 | 0.5 |
| Services less Energy | 0.1 | 0.4 | 0.3 | 3.2 | 3.4 | 3.4 | 2.8 |
| Energy | -0.5 | 0.7 | 1.7 | 18.9 | 5.6 | 11.0 | 17.0 |
| Food & Beverages | 0.4 | 0.7 | 0.1 | 4.6 | 4.0 | 2.3 | 2.5 |
| Chained CPI: Total (NSA) | 0.3 | 0.5 | -0.1 | 3.7 | 2.5 | 2.9 | 2.9 |
| Total less Food & Energy | 0.3 | 0.3 | -0.1 | 2.0 | 2.0 | 2.2 | 1.9 |
by Tom Moeller March 14, 2008
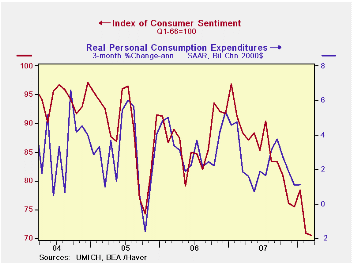
The University of Michigan's consumer sentiment index, in the preliminary reading for March, fell another 0.4% m/m to 70.5 after the 9.7% plunge during February. Consensus expectations had been for a somewhat sharper decline to a reading of 70.1 for early this month.
A lower index of expected business conditions during the next
year accounted for all of the decline in overall March sentiment. The
1.6% decline followed an 8.4% February drop and left the index at its
lowest since early 1992. Expectations for business conditions during
the next year fell 6.0% (-49.5% y/y) but expectations for conditions
over the next five years rose, making up virtually all of a February
decline. They remained down 7.4% y/y. Expectations for personal
finances also improved and made up a February drop but still were down
7.4% y/y.
Opinions about government policy were stable m/m (-22.5% y/y) following the sharp 11.5% shortfall during February. The percentage of those surveyed who indicated that they thought government was doing a good job made up the February decline. They rose to 13% but an increased 44% had a poor opinion.
Expectations for inflation during the next twelve months surged to 4.6%, the highest level in nearly two years though inflation expectations during the next five to ten years fell slightly to 3.3%.
The current conditions index rose a slight 1.0% m/m after the 11.2% February slide. The view of current conditions for buying large household goods ticked up 1.6% after falling 15.8% m/m in February and the view of current personal finances was unchanged after a 4.1% (-15.3% y/y) February drop.
The University of Michigan survey is not seasonally adjusted.The reading is based on telephone interviews with about 500 households at month-end; the mid-month results are based on about 300 interviews. The summary indexes are in Haver's USECON database, with details in the proprietary UMSCA database.
Assessing Employment Growth in 2007 from the Federal Reserve Bank of San Francisco can be found here.
| University of Michigan | March (Prelim) | Feb | Jan | March y/y | 2007 | 2006 | 2005 |
|---|---|---|---|---|---|---|---|
| Consumer Sentiment | 70.5 | 70.8 | 78.4 | -20.2% | 85.6 | 87.3 | 88.5 |
| Current Conditions | 84.6 | 83.8 | 94.4 | -18.3% | 101.2 | 105.1 | 105.9 |
| Expectations | 61.4 | 62.4 | 68.1 | -22.0% | 75.6 | 75.9 | 77.4 |
by Robert Brusca March 14, 2008
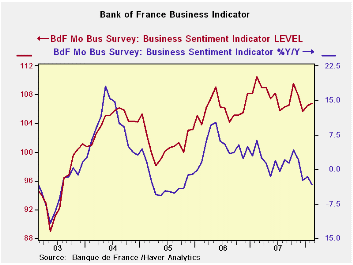
The Bank of France has put the logical spin on its survey as showing that growth continues.
After a marked slowdown in French GDP growth in 4Q, the new BoF survey shows that activity has picked up somewhat, although the Industry sentiment index is still below its 12-month average.On the basis of its February business survey, the central bank actually has revised down its projection for Q1 GDP growth to 0.4% from the 0.5% it initially forecast. This is just below the December forecast of the national statistics institute Insee and just above the 0.3% gain in 4Q.
Industry output continued to expand in February but less strongly than in January, to say the least. The February reading for production is 4.55 compared to 19.17 for January and a 12-month average of +7. Weaker gains were reported in most sectors. Autos posted an outright decline in February after a spike in January and a decline in the auto output in December. Manufacturing capacity utilization slipped to 83.4% after a rebound in January to 83.5%, remaining above the long-term average of 83 since 1987 but below the average of 84 for the last 12 months.
Executives said new domestic orders slowed in February and overall order books were somewhat lighter, in fact at 8.76 they are below the 12-month average for orders and below the long-term average of 9.
Growth also slowed in most segments of the services sector in February.
Activity is expected to continue to expand in most branches but at a more moderate pace. Foreign orders gains were much weaker in February, as the euro climbed. Importantly, service providers indicated that price hikes would be slightly less rapid in the months ahead. Cleary the BoF has put some positive spin on the report in which growth is indicated but momentum seems to be fading.
Going back to 1987 the semi-finished goods sector is in dire straits with the lowest production outlook and lowest new orders it has ever seen. Production in this sector is in the bottom 16 percent of the range for orders in the past 30 years. Auto sector production is in the bottom third of its range as is the agriculture and food sector; consumer goods production is in the bottom 42 percent of its range. The production outlook for capital goods and consumer goods is the lower 36th percentile and lower 15th percentile of their respective ranges. This report is really very weak.
| Bank of France Monthly INDUSTRY Survey: SUMMARY | ||||||
|---|---|---|---|---|---|---|
| 12 MO | Since Jan-87 | 2Yr Percentile | ||||
| Feb-08 | Jan-08 | Dec-07 | AVERAGE | Average | rank/range | |
| Production-latest mo | ||||||
| Total Industry | 5.44 | 19.17 | -4.13 | 7 | 7 | 32.5% |
| Production Outlook | ||||||
| Total Industry | 12.91 | 15.86 | 22.21 | 16 | 15 | 29.4% |
| Demand | ||||||
| Overall order books | 22.81 | 24.85 | 25.33 | 27 | 4 | 39.7% |
| Foreign Orders | 10.24 | 10.87 | 8.89 | 11 | 9 | 27.0% |
| New Orders | ||||||
| Total Industry | 8.76 | 12.28 | 9.3 | 10 | 9 | 18.9% |
| Stocks: Finished Gds | ||||||
| Total Industry | -3.76 | -1.88 | -4.76 | -3 | -2 | 22.1% |
| Capacity Utilization | 83.35 | 83.48 | 80.86 | 84 | 83 | 57.2% |
| Hiring | ||||||
| Latest Mo | 0.41 | 2.74 | -1.43 | 0 | -1 | 74.8% |
| Outlook | -0.44 | -1.48 | -0.67 | -2 | -4 | 88.5% |
| Industry Sentiment Index | 106.8 | 106.47 | 105.68 | 107 | 107 | 48.3% |
by Robert Brusca March 14, 2008
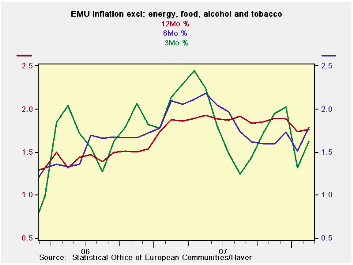
The upward-revised headline EMU inflation rate leaves the ECB even more perturbed over events. While a tenth of a percentage point upward revision is no big deal, it makes the highest inflation on record since the Euro Area was formed even higher. Some members have said that the revision is a further risk to second round effects. To the extent that the public sees it and makes that their wage target based on that higher rate, it is so.
The chart on the lest shows the ‘core’ inflation rate, without food and energy and ‘sin’ (alcohol and tobacco). The core rate is in better shape and it shows a muted pass-through of inflation. At 2.4% year/year it is about what US core inflation is (2.3% for ex food and energy inflation). The ECB is making a big deal of inflation over its ceiling of 2% while the Fed ‘references’ the core PCE which is lower than the Core CPI. The Core CPI is now below its Core-PCE-equivalent ‘reference ceiling’ of 2.4%. But since the ECB thinks in terms of headline inflation only, its shortfall is not 2.4% (core) Vs 2% but 3.3% Vs 2% and that is a much bigger distance. For the record US headline inflation is even higher. Who is doing this the right way?
Central banks are what they make themselves into and what their mandate demands. The US has seen enough weakness to react to the economy and financial strife by cutting rates. And that works for a central bank with a dual growth and inflation mandate. The ECB has no such mandate. It is strictly to fight inflation and so it is doing that, for better or worse. Meanwhile, however, the euro continues to climb and that has its own deflationary consequences for the Euro Area. It seems everyone in the Euro Area is worried about it. Perhaps that is the way out for the ECB to see what the strong euro is doing to help fight inflation as well as undermine growth. Holding policy steady until inflation breaks noticeably could be a problem since commodity prices are high enough that even with euro strength they are and will be an inflation contributor for a while longer. Central banks have entered the very foggy ‘judgment zone.’
One thing we can conclude is that with the weaker economy in the US and the brunt of the financial problems there, it is a good thing that the Fed is the central bank with the dual mandate and not vice versa. In the meantime look for central banks to muddle though under their own existing rules. Inflation may be near peaking since it’s hard to imagine another move up in commodity prices to any significant degree from these levels.
| Trends in HICP | |||||||
|---|---|---|---|---|---|---|---|
| % mo/mo | % saar | ||||||
| Feb-08 | Jan-08 | Dec-07 | 3-Mo | 6-Mo | 12-Mo | Yr Ago | |
| EMU-13 | 0.3% | 0.3% | 0.2% | 2.8% | 4.5% | 3.3% | 1.9% |
| Core | 0.3% | 0.1% | 0.2% | 2.6% | 2.9% | 2.4% | 1.9% |
| Goods | 0.3% | -0.5% | 0.1% | -0.8% | 5.3% | 3.8% | 1.5% |
| Services | 0.5% | -0.2% | 0.9% | 4.9% | 1.1% | 2.5% | 2.4% |
| HICP | |||||||
| Germany | 0.2% | 0.3% | -0.2% | 1.1% | 3.9% | 2.9% | 2.0% |
| France | 0.0% | 0.3% | 0.4% | 3.0% | 4.1% | 3.2% | 1.2% |
| Italy | 0.6% | 0.1% | 0.4% | 4.2% | 4.7% | 3.1% | 2.2% |
| Spain | 0.4% | 0.2% | 0.5% | 4.6% | 6.1% | 4.4% | 2.5% |
| Core:xFE&A | |||||||
| Germany | 0.3% | -0.2% | 0.3% | 1.5% | 2.1% | 2.2% | 1.8% |
| France | 0.1% | 0.3% | 0.3% | 2.7% | 2.7% | 2.3% | 1.4% |
| Italy | 0.4% | 0.0% | 0.3% | 2.7% | 3.1% | 2.5% | 2.1% |
| Spain | 0.3% | 0.2% | 0.3% | 3.2% | 4.1% | 3.3% | 2.8% |

Tom Moeller
AuthorMore in Author Profile »Prior to joining Haver Analytics in 2000, Mr. Moeller worked as the Economist at Chancellor Capital Management from 1985 to 1999. There, he developed comprehensive economic forecasts and interpreted economic data for equity and fixed income portfolio managers. Also at Chancellor, Mr. Moeller worked as an equity analyst and was responsible for researching and rating companies in the economically sensitive automobile and housing industries for investment in Chancellor’s equity portfolio. Prior to joining Chancellor, Mr. Moeller was an Economist at Citibank from 1979 to 1984. He also analyzed pricing behavior in the metals industry for the Council on Wage and Price Stability in Washington, D.C. In 1999, Mr. Moeller received the award for most accurate forecast from the Forecasters' Club of New York. From 1990 to 1992 he was President of the New York Association for Business Economists. Mr. Moeller earned an M.B.A. in Finance from Fordham University, where he graduated in 1987. He holds a Bachelor of Arts in Economics from George Washington University.
More Economy in Brief


