 Global| Jan 16 2008
U.S. CPI Total & Core Tame
by:Tom Moeller
|in:Economy in Brief
Summary
The consumer price index (CPI-U) last month rose 0.3%. The increase was slightly ahead of expectations for a 0.2% rise. It was well below the heightened 0.8% November jump and equal to the gains of the prior two months, Nevertheless, [...]
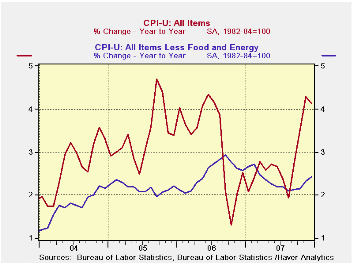
The consumer price index (CPI-U) last month rose 0.3%. The increase was slightly ahead of expectations for a 0.2% rise. It was well below the heightened 0.8% November jump and equal to the gains of the prior two months, Nevertheless, the Dec/Dec gain of 4.1% was the fastest since a 6.3% spike in 1990.
Consumer price inflation less food
& energy in December dropped slightly to 0.2% from November's
gain of 0.3%. The rise equaled the increases during the prior five
months and matched Consensus expectations. The Dec/Dec increase of 2.4%
was down from the 2006 rise of 2.6% but up from the four years prior.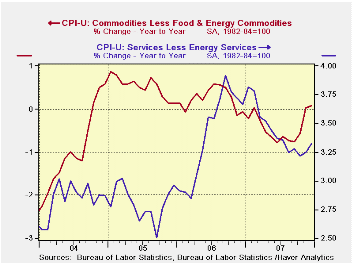
A Comparison of Measures of Core Inflation from the Federal Reserve Bank of New York can be found here.
Tobacco prices provided oomph to December costs with a 0.8% (7.5% y/y) rise, but not enough to much influence the overall price picture. Less tobacco, core consumer prices rose 0.2% 2.4% (y/y)
Energy prices decelerated last month to a 0.9% increase from the 5.9% November rise. The deceleration was not enough, however, to keep the Dec/Dec rise from outpacing all increases since 1990. Gasoline prices rose another firm 1.1% (29.6% y/y) after November's 9.3% spike and the weekly data already show a 2.4% m/m rise in January. Prices for fuel oil & other fuels rose 2.0% (28.4% y/y) and natural gas & electricity prices increased 0.5% (3.5% y/y).
Food & beverage prices were
unchanged m/m but again the y/y story is one of acceleration, in this
case sharp acceleration. The 4.8% Dec/Dec gain was the quickest since
1990. Though prices of dairy products slipped 0.4% last month, the Y/Y
rise of 13.4% was the fastest since a 22.6% spike during 1973. Prices
for fruits & vegetable fell 0.4% (+5.9% y/y) and but prices for
meats, poultry & fish fell 0.1% (+5.3% y/y).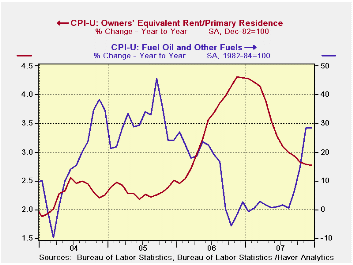
Core goods prices were unchanged and the 0.1% rise was the weakest since 2004. Apparel prices rose 0.2% last month but fell 0.3% y/y. The pattern was the same for prices of new & used motor vehicles which rose 0.1% during December but fell 0.1% y/y. Prices of household furnishings & operation were unchanged and fell 0.8% y/y.
Core services prices rose 0.3% (3.3% y/y) for the second month. Shelter prices increased 0.3% (3.1% y/y) and the y/y gain was down from 4.1 during 2006. Owners equivalent rent of primary residence, a measure not equivalent to other house price measures, rose 0.3%, reducing the y/y gain to 2.8% y/y. The Y/Y rise was down from 4.3% in 2006. Public transportation prices popped again, last month by 1.2% (7.2% y/y) and medical care services prices rose 0.3% (5.9% y/y). Tuition rose 0.5% (5.4% y/y), though the firm y/y gain was the weakest since 2001.
The chained CPI, which adjusts for shifts in the mix of consumer purchases fell 0.1% (+3.4% y/y) and the core measure also fell 0.1%. This latter measure is similar to the core PCE price index but its treatment of housing price differs
| Consumer Price Index | December | November | October | Dec Y/Y | 2007 | 2006 | 2005 |
|---|---|---|---|---|---|---|---|
| Total | 0.3% | 0.8% | 0.3% | 4.1% | 2.9% | 3.2% | 3.4% |
| Total less Food & Energy | 0.2% | 0.3% | 0.2% | 2.4% | 2.3% | 2.5% | 2.2% |
| Goods less Food & Energy | 0.0% | 0.2% | -0.0% | 0.1% | -0.4% | 0.2% | 0.5% |
| Services less Energy | 0.3% | 0.3% | 0.2% | 3.3% | 3.4% | 3.4% | 2.8% |
| Energy | 0.9% | 5.7% | 1.4% | 17.5% | 5.6% | 11.1% | 16.9% |
| Food & Beverages | 0.0% | 0.3% | 0.3% | 4.8% | 3.9% | 2.3% | 2.4% |
| Chained CPI: Total (NSA) | -0.1% | 0.4% | 0.2% | 3.4% | 2.5% | 2.8% | 2.9% |
| Total less Food & Energy | -0.1% | 0.0% | 0.3% | 2.1% | 2.0% | 2.3% | 1.9% |
by Tom Moeller January 16, 2008
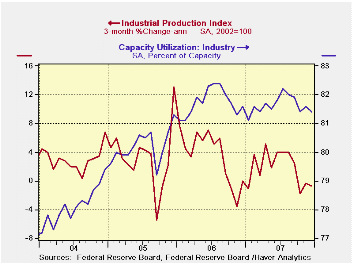
Industrial production was unchanged last month, a bit better than the expected slight decline. That followed an unrevised 0.3% November rise. For all of last year, the 1.6% increase in output was the weakest since 2003.
The latest output level is, however, 0.8% below its July peak and a move below peak historically has been associated with an economic recession. Has one begun? Other coincident economic indicators suggest not. Employment is up. Business sales are up. And income, though weak, is up.
Factory output also was unchanged after an unrevised 0.3% November increase. Three month growth in output fell to -1.4% (AR) and the latest level was 0.8% below its July peak.
Production in the motor vehicle & parts industries
fell 0.4% and output was 5.2% below its July peak. The decline in
output of furniture & related products was strong at -1.3%
(-2.3% y/y) and it was 2.8% below peak. Output of construction supplies
fell for the sixth consecutive month. The 0.9% (-2.2% y/y) drop pulled
output 2.6% below its June peak.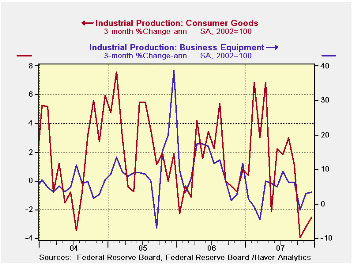
Elsewhere in the consumer goods sector output was firmer. Production of computers & electronics slipped 0.2% but was up 13.1% y/y. Output of apparel jumped 1.7% but remained down 1.5% y/y)
Output of business equipment rose a solid 0.9% (2.4% y/y). Output of information & processing equipment rose 0.5% (8.2% y/y) after a 2.1% November surge. Output of industrial equipment rose 0.4% (-0.8% y/y).
In the materials category output fell 0.3% but it was up 2.3% for the year. Production of durable consumer parts slipped 0.3% (+2.3 y/y). Production of durable equipment parts fell 0.4% (+3.7% y/y) but consumer durable parts output (-2.7% y/y) fell for the fourth month in five.
Capacity utilization fell to 81.4% from a revised 81.4% and that was below the 2007 average of 81.6% which was down a bit from 81.7% in 2006. Utilization in the factory sector slipped more decidedly to 79.7% from its 207 average of 80.1% and from its July peak of 81.0%. Capacity grew 1.8% last year.
| INDUSTRIAL PRODUCTION (SA) | December | November | Y/Y | 2007 | 2006 | 2005 |
|---|---|---|---|---|---|---|
| Total | 0.0% | 0.3% | 1.6% | 1.9% | 4.0% | 3.2% |
| Manufacturing | 0.0% | 0.3% | 1.1% | 1.9% | 4.7% | 3.9% |
by Tom Moeller January 16, 2008
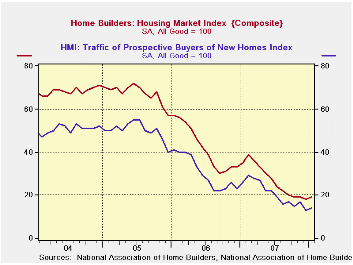
For January, the Composite Housing Market Index from the National Association of Home Builders' (NAHB) remained low versus a December reading that was revised up slightly.
The index was stable in the Northeast (-47.4 % y/y) but fell sharply in the West (-60.6% y/y). It rose slightly m/m in the South (-43.9 y/y and in the Midwest (-29.2% y/y).
During the last twenty years there has been a 76% correlation
between the y/y change in the Composite Index and the change in single
family housing starts.
The sub-index from the NAHB for current sales Nationwide was stable m/m and remained down 76% from the 2004 high.
The sub-index covering prospective sales in the next six months ticked up slightly for the second month.
Traffic of prospective home buyers virtually dried up and remained down three quarters 2005 high.
The NAHB index is a diffusion index based on a survey of
builders. Readings above 50 signal that more builders view conditions
good than poor.
Visit the National Association of Home Builders.
| Nat'l Association of Home Builders | January | December | Jan. '07 | 2007 | 2006 | 2005 |
|---|---|---|---|---|---|---|
| Composite Housing Market Index | 19 | 18 | 35 | 27 | 42 | 67 |
by Robert Brusca January 16, 2008
The UK economy continues to be a bit enigmatic. Unemployment
is still declining. Economic activity seems to blow and cold. The
financial chaos is threatening to take Northern Rock into the public
domain. The economy is clearly battered but at the same it shows some
resilience and that goes for some of its inflation measures as well…but
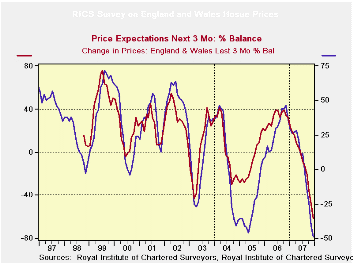
not so those for house prices. The RICS survey on housing prices finds
that the breadth of price declines is increasing. The current reading
on prices, price expectations and sales expectations are all on
lifetime lows for those series, respectively. New sales are weak but
comparatively seem full of life in the bottom 23 percent of their range
(ranges since 1999). Both Price and price expectations are on extreme
down legs of their respective cycles. And even with the new lifetime
lows neither shows any sign of slowing down it pace of descent.
| RICS: House prices and expectations for prices and sales | |||||||
|---|---|---|---|---|---|---|---|
| Dec-07 | Nov-07 | Oct-07 | 3-Mo Avg | 6-Mo Avg | 12-Mo Avg | Range Percentile |
|
| Prices | -49 | -41 | -24 | -38 | -20 | 2 | 0.0% |
| Price Expectations | -62 | -48 | -36 | -49 | -32 | -10 | 0.0% |
| Sales expectations | -19 | -8 | -6 | -11 | -9 | 3 | 0.0% |
| New Sales | -21 | -35 | -32 | -29 | -26 | -13 | 23.0% |
| Range percentile takes range back to 1999 | |||||||

Tom Moeller
AuthorMore in Author Profile »Prior to joining Haver Analytics in 2000, Mr. Moeller worked as the Economist at Chancellor Capital Management from 1985 to 1999. There, he developed comprehensive economic forecasts and interpreted economic data for equity and fixed income portfolio managers. Also at Chancellor, Mr. Moeller worked as an equity analyst and was responsible for researching and rating companies in the economically sensitive automobile and housing industries for investment in Chancellor’s equity portfolio. Prior to joining Chancellor, Mr. Moeller was an Economist at Citibank from 1979 to 1984. He also analyzed pricing behavior in the metals industry for the Council on Wage and Price Stability in Washington, D.C. In 1999, Mr. Moeller received the award for most accurate forecast from the Forecasters' Club of New York. From 1990 to 1992 he was President of the New York Association for Business Economists. Mr. Moeller earned an M.B.A. in Finance from Fordham University, where he graduated in 1987. He holds a Bachelor of Arts in Economics from George Washington University.
More Economy in Brief


