 Global| Dec 16 2008
U.S. CPI Fell By A Record 1.7%
by:Tom Moeller
|in:Economy in Brief
Summary
The consumer price index (CPI-U) fell by a record 1.7% during November versus October, according to the Bureau of Labor Statistics. Indeed, the decline was the greatest in the series' history which dates back to 1947. The latest fall [...]
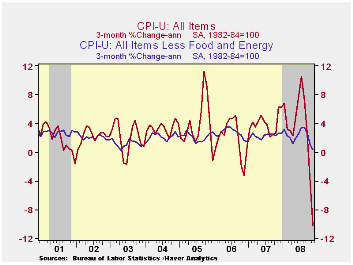
The consumer price index (CPI-U) fell by a record 1.7% during November versus October, according to the Bureau of Labor Statistics. Indeed, the decline was the greatest in the series' history which dates back to 1947. The latest fall nearly doubled the October drop of 1.0% and it compared to Consensus expectations for a 1.3% decline. The latest reading lowered the three-month rate of change to -10.2% (AR).
There has been an about-face in fuels' prices since earlier this year and lower energy prices account for most of the recent decline in the total CPI. After rising sharply through July, they've fallen each month by a total of 27.9%. In November alone, energy prices fell 17.0% from October and the drop was led by a record 29.5% fall in gasoline prices (-29.5% y/y) to an average of $2.15 per gallon. Gas prices have moved even lower this month to $1.66. Fuel oil prices fell 13.6% (-3.4% y/y) for the fourth consecutive monthly drop and prices for natural gas & electricity fell 1.0% m/m (+8.1% y/y).
Last month, food & beverage prices continued to buck that downtrend with a 0.2% increase. Perhaps the good news is that the gain was the weakest since February and the running 3-month rate of increase fell to 4.1%, down from a high of 9.1% this past August. Nevertheless, the three-month rate of increase in prices of cereals & bakery products was 7.8% versus a recent high of 19.5% and prices of meats, poultry & fish rose at a 3.5% rate versus the high of 10.9%.
Recent weakness in consumer prices has been reinforced by a decline in core pricing power. The CPI less food & energy was unchanged last month versus Consensus expectations for a 0.1% uptick. The three-month annual rate of increase fell to 1.1% from its July high of 3.5%.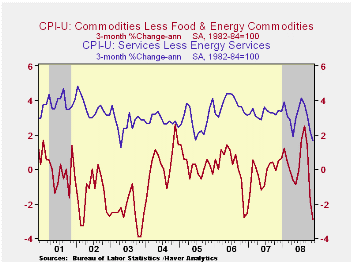
Core goods prices, down 0.2%, fell for the third straight month and the three-month rate of decline amounted to 2.9% which was the weakest since late-2003. The latest decline was led again by lower prices for new & used motor vehicles which were down another 0.9% (-3.1% y/y). Apparel prices ticked up 0.3% (0.0% y/y) after their sharp 1.0% October decline. Prices for household furnishings & operations reflected the weakness in the housing sector and fell 0.2% (+1.8% y/y). Tobacco prices were unchanged for the second month in the last three but they still rose 6.7% y/y.
Core services prices ticked up 0.1%. The three-month growth rate of 2.1% matched the lowest since 2005 which was the least since 2001. Medical care services prices rose just 0.1% (3.1% y/y) but education costs remained firm. They increased 0.4% for the third straight month (5.7% y/y). Shelter prices rose 0.2% (2.1% y/y). As the housing market remained deeply depressed the y/y increase was miniscule. Owners equivalent rent of primary residence, a measure not equivalent to other house price measures, rose 0.3% (2.3% y/y) while rents rose 0.3% (3.6% y/y). Public transportation prices fell for the third consecutive month and the 4.1% year-to-year rate of increase was down from 15.2% this past August. Recreation prices were unchanged (2.0% y/y).
The chained CPI, which adjusts for shifts in consumption patterns, fell 2.0%. Less food and energy, chained prices fell 0.3%.
| Consumer Price Index (%) | November | October | Y/Y | 2007 | 2006 | 2005 |
|---|---|---|---|---|---|---|
| Total | -1.7 | -1.0 | 1.0 | 2.9 | 3.2 | 3.4 |
| Total less Food & Energy | 0.0 | -0.1 | 2.0 | 2.3 | 2.5 | 2.2 |
| Goods less Food & Energy | -0.2 | -0.4 | -0.2 | -0.4 | 0.2 | 0.5 |
| Services less Energy | 0.1 | 0.0 | 2.9 | 3.4 | 3.4 | 2.8 |
| Energy | -17.0 | -8.6 | -13.4 | 5.6 | 11.0 | 17.0 |
| Food & Beverages | 0.2 | 0.3 | 5.9 | 3.9 | 2.3 | 2.5 |
| Chained CPI: Total (NSA) | -2.0 | -0.8 | 0.7 | 2.5 | 2.9 | 2.9 |
| Total less Food & Energy | -0.3 | 0.1 | 1.6 | 2.0 | 2.2 | 1.9 |

Tom Moeller
AuthorMore in Author Profile »Prior to joining Haver Analytics in 2000, Mr. Moeller worked as the Economist at Chancellor Capital Management from 1985 to 1999. There, he developed comprehensive economic forecasts and interpreted economic data for equity and fixed income portfolio managers. Also at Chancellor, Mr. Moeller worked as an equity analyst and was responsible for researching and rating companies in the economically sensitive automobile and housing industries for investment in Chancellor’s equity portfolio. Prior to joining Chancellor, Mr. Moeller was an Economist at Citibank from 1979 to 1984. He also analyzed pricing behavior in the metals industry for the Council on Wage and Price Stability in Washington, D.C. In 1999, Mr. Moeller received the award for most accurate forecast from the Forecasters' Club of New York. From 1990 to 1992 he was President of the New York Association for Business Economists. Mr. Moeller earned an M.B.A. in Finance from Fordham University, where he graduated in 1987. He holds a Bachelor of Arts in Economics from George Washington University.
More Economy in Brief


