 Global| Jan 16 2009
U.S. CPI Fell A Third Month Due ToLower Energy Prices
by:Tom Moeller
|in:Economy in Brief
Summary
According to the Bureau of Labor Statistics, the consumer price index (CPI-U) fell for the third straight month in December. The 0.7% decline followed drops of 1.7% and 1.0% during November and October. Indeed. that, understates the [...]
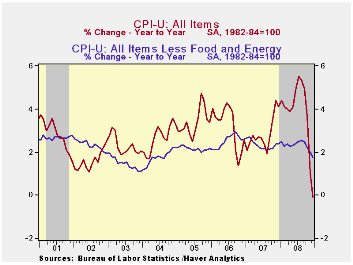 According
to the Bureau of Labor Statistics, the consumer price index
(CPI-U) fell for the third straight month in December. The 0.7% decline
followed drops of 1.7% and 1.0% during November and October. Indeed.
that, understates the weakness in pricing since there was a
less-than-0.1% decline in September. The latest reading lowered the
three-month rate of change to -12.7% (AR). That pulled
seasonally adjusted prices lower by 0.1% for the last twelve months,
the first such decline since 1955. The recent figure
compared to Consensus expectations for a 0.9% decline.
According
to the Bureau of Labor Statistics, the consumer price index
(CPI-U) fell for the third straight month in December. The 0.7% decline
followed drops of 1.7% and 1.0% during November and October. Indeed.
that, understates the weakness in pricing since there was a
less-than-0.1% decline in September. The latest reading lowered the
three-month rate of change to -12.7% (AR). That pulled
seasonally adjusted prices lower by 0.1% for the last twelve months,
the first such decline since 1955. The recent figure
compared to Consensus expectations for a 0.9% decline.
Lower energy prices led the weakness in last month's CPI with an 8.3% decline, the fifth consecutive monthly drop. It was paced by a 17.2% decline in gasoline prices to an average of $1.69 per gallon. Gas prices have backed up a bit this in January to an average $1.78 last week. December fuel oil prices fell 9.2% (-14.4% y/y) for their fifth consecutive monthly drop and prices for natural gas & electricity were roughly unchanged m/m (+7.9% y/y).
Increases in food & beverage prices tapered off and posted a slight December decline. That followed moderate increases of 0.3% and 0.2% during the prior two months. However, monthly increases between 0.6% and 0.9% were common earlier in the year. Therefore, the year-to-year growth in food prices during 2008 was the strongest since 1981.
 Core pricing power
also weakened further in December with the developing recession. The CPI
less food & energy slipped and it was down at a 0.3%
annual rate during the last three months. It reached a peak three-month
rate of increase of 3.5% just this past July and the latest change was
the weakest since 1982.
Core pricing power
also weakened further in December with the developing recession. The CPI
less food & energy slipped and it was down at a 0.3%
annual rate during the last three months. It reached a peak three-month
rate of increase of 3.5% just this past July and the latest change was
the weakest since 1982.
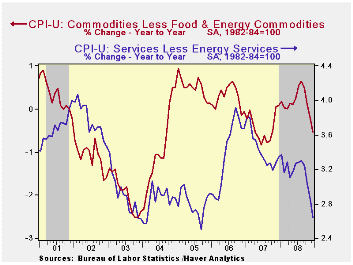
Core goods prices fell for the fourth consecutive month. The 0.3% decline pulled the three-month rate of change to a negative 3.4% which was the weakest since late-2003. The latest decline was led by another fall in prices of new & used motor vehicles which were off 0.4% (-3.5% y/y). Apparel prices also fell last month by 0.9% and they dropped 1.0% last year. Prices for household furnishings & operations ticked up 0.1% after their 0.2% November drop. However, the 2.0% year-to-year gain was the firmest since 2005. Tobacco prices rose 0.5% last month and they were up 6.3% during the full year.
Core services prices again
ticked up by 0.1% and they rose at a 1.0% annual rate during the last
three months. That was the lowest rate of increase since
1982. Medical care services prices rose a moderate 0.2% (3.0%
y/y) but education costs remained strong. They posted a 0.5%
increase (5.6% y/y) during December. 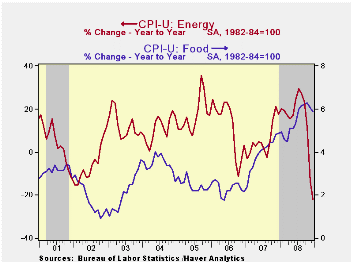 Shelter prices were unchanged m/m
and the year-to-year gain of 1.9% was the weakest since 2005. As the
housing market remained deeply depressed owners equivalent rent of
primary residence, a measure not equivalent to other house price
measures, rose just 0.1% (2.1% y/y). Public transportation
prices fell for the fourth consecutive month and were up just 1.8%
year-to-year. Recreation prices fell 0.2% and they rose a modest 1.8%
y/y.
Shelter prices were unchanged m/m
and the year-to-year gain of 1.9% was the weakest since 2005. As the
housing market remained deeply depressed owners equivalent rent of
primary residence, a measure not equivalent to other house price
measures, rose just 0.1% (2.1% y/y). Public transportation
prices fell for the fourth consecutive month and were up just 1.8%
year-to-year. Recreation prices fell 0.2% and they rose a modest 1.8%
y/y.
The chained CPI, which adjusts for shifts in consumption patterns, fell 1.3%. Less food and energy, chained prices fell 0.3% for the second month and the year-to-year gain of 1.3% was the lowest since early 2004.
Rethinking the Measurement of Household Inflation Expectations: Preliminary Findings from the Federal Reserve Bank of New York is available here.
| Consumer Price Index (%) | December | November | Y/Y | 2008 | 2007 | 2006 |
|---|---|---|---|---|---|---|
| Total | -0.7 | -1.7 | -0.1 | 3.8 | 2.9 | 3.2 |
| Total less Food & Energy | -0.0 | 0.0 | 1.7 | 2.3 | 2.3 | 2.5 |
| Goods less Food & Energy | -0.3 | -0.2 | -0.5 | 0.1 | -0.4 | 0.2 |
| Services less Energy | 0.1 | 0.1 | 2.6 | 3.1 | 3.4 | 3.4 |
| Energy | -8.3 | -17.0 | -21.9 | 13.6 | 5.6 | 11.0 |
| Food & Beverages | -0.0 | 0.2 | 5.8 | 5.4 | 3.9 | 2.3 |
| Chained CPI: Total (NSA) | -1.3 | -2.0 | -0.5 | 3.3 | 2.5 | 2.9 |
| Total less Food & Energy | -0.3 | -0.3 | 1.3 | 2.0 | 2.0 | 2.2 |
by Robert Brusca January 16, 2009
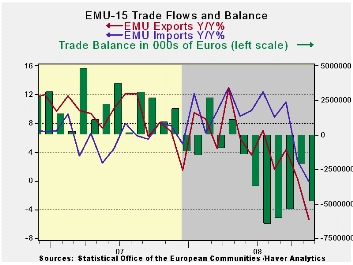
The EMU trade deficit widened in November as exports fell by
4.7%. Imports also dropped but by 2.5% causing the deficit to widen.
The table above is replete with negative numbers denoting declining
export and import flows. The global downturn is hitting trade hard on
both the export and the import side. Among exports raw materials and
manufactured goods are both being hit hard. On the import side weakness
is in oil imports but spreads across all groupings.
Over 12-months exports are lower by 5.1% and imports are off
by 0.1%. In contrast a year before exports had risen over 12-months by
6.8% and imports were up by 7.7%. Even in Yr/Yr terms the slowdown is
rapid and that is why the economic dislocations are so severe.
The figures for EMU are of course figures for EMU member trade
outside of the block. The various national figures also include
intra-EMU state trading. EMU countries are very prone to trade. Since
these flows are slowing down it is hitting a lot of EMU economies very
hard. Germany, the largest exporter in the world, is being clobbered by
export weakness. German exports are down by 9% Yr/Yr in November,
nearly twice the EMU pace. The trade picture is a bleak one for EMU
members.
| Ezone 15-Trade trends for goods | ||||||
|---|---|---|---|---|---|---|
| m/m% | % Saar | |||||
| Nov-08 | Oct-08 | 3M | 6M | 12M | 12M Ago | |
| Balance* | €€ (4,891) | €€ (2,122) | €€ (4,154) | €€ (4,800) | €€ 2,124 | €€ (1,483) |
| Exports | ||||||
| All Exp | -4.7% | -2.8% | -22.6% | -10.8% | -5.3% | 6.8% |
| Food and Drinks | -3.0% | 0.9% | -5.2% | -3.3% | 1.6% | 12.9% |
| Raw materials | -13.0% | -3.2% | -58.8% | -34.9% | -12.2% | -0.2% |
| Other | -4.6% | -3.0% | -22.6% | -10.6% | -5.7% | 6.6% |
| MFG | -4.0% | -1.6% | -22.8% | -10.8% | -6.6% | 4.2% |
| IMPORTS | ||||||
| All IMP | -2.5% | -5.1% | -24.5% | -5.6% | -0.1% | 7.7% |
| Food and Drinks | -2.9% | -1.3% | -12.4% | -7.8% | -3.7% | 18.0% |
| Raw materials | -0.4% | -4.5% | -6.7% | 4.8% | 8.3% | 1.4% |
| Other | -2.6% | -5.3% | -26.0% | -6.1% | -0.3% | 7.4% |
| MFG | -0.5% | -2.3% | -12.9% | -1.8% | -1.3% | 3.6% |
| *Eur mlns; mo or period average | ||||||
by Tom Moeller January 16, 2009
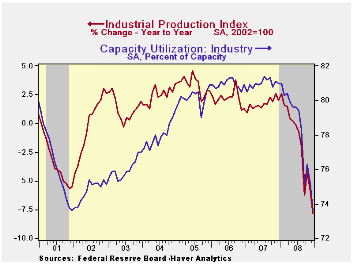
Industrial production during December fell for the ninth month
of 2008. The 2.0% drop followed a 1.3% November decline which was
revised deeper from the initial report. Last month's decline was double
Consensus expectations for a 1.0% decline. For the year,
industrial production declined 7.8% which was the sharpest negative
twelve-month change since the deep recession of 1975.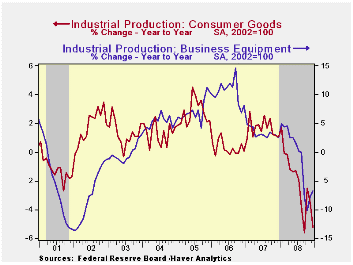
Factory output took the brunt of the recession's force and declined 9.9% last year. That was led by a 13.9% twelve-month decline in output of construction supplies, again the deepest since 1975. Output of consumer goods fell 5.2% during last year, pulled lower by a 26.7% December-to-December drop in the output of motor vehicles & parts. That came on top of roughly 3% declines during the prior two years. Outside of the auto sector output also was hard it and production of furniture fell 21.9% while apparel output dropped 6.0%. Production of business equipment was late to the recession's downturn, but for the year production fell 6.7%.
Industrial production in the high-tech sector fell 6.5% last year. That was the worst performance since 2001. Outside of high-tech production declines amounted to 11.0% for the year, the worst decline since 1975.
Less the weakness in autos and high tech, output fell 6.9% last year, the steepest since 1982. Machinery production led that fall with a steep 11.6% drop while output of electrical equipment production also fell, but by 9.5% y/y. Production of chemicals fell 11.6% y/y, also the worst since 1975, but apparel output fell a modest 6.0%.
Capacity utilization fell to 73.6%, the lowest level since 2003. Utilization in the factory sector dropped further, however, to 70.2%, its lowest since 1982. Capacity in the factory sector increased a firm 1.7% y/y).
| INDUSTRIAL PRODUCTION (SA, %) | December | November | Y/Y | 2008 | 2007 | 2006 |
|---|---|---|---|---|---|---|
| Total Output | -2.0 | -1.3 | -7.8 | -1.8 | 1.7 | 2.2 |
| Manufacturing | -2.4 | -2.2 | -9.9 | -2.5 | 1.7 | 2.4 |
| Consumer Goods | -1.7 | -1.0 | -5.2 | -2.1 | 1.7 | 0.3 |
| Business Equipment | 1.8 | 2.9 | -6.7 | -1.1 | 3.3 | 10.4 |
| Construction Supplies | -3.3 | -4.6 | -13.9 | -6.1 | -2.5 | 2.2 |
| Utilities | -0.1 | 0.9 | 0.5 | 0.4 | 3.3 | -0.6 |
| Capacity Utilization | 73.6 | 75.2 | 81.0 (Dec.'07) | 78.2 | 81.0 | 80.9 |
by Tom Moeller January 16, 2009
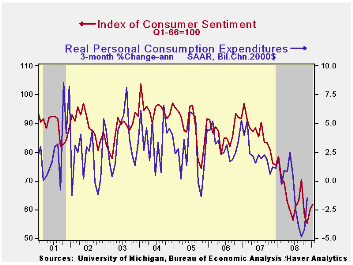
For early January, the University of Michigan reported that consumer sentiment rose slightly for the second month. The 3.0% rise followed an 8.7% increase off the cycle's low in November. Nevertheless, at 61.9 the latest level was near the lowest for the series back to 1980 and earlier. Moreover, the figure remained down by nearly one quarter from last year after the 25.5% decline during all of 2008. The latest reading beat Consensus expectations for a reading of 59.0.
During the last ten years there has been a 58% correlation
between the level of sentiment and the three-month change in real
consumer spending.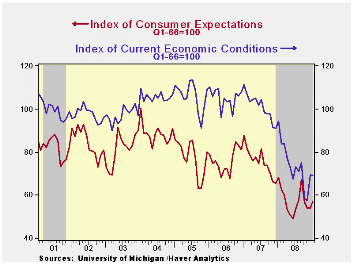
The expectations component of consumer sentiment rose moderately to the highest level since October. Still, the series was near its lowest since 1990 and close to the low of 1980. Expectations for business conditions during the next year more than recovered the December drop and expectations for conditions during the next five years ticked up as well. The expected change in personal finances rose to the highest level since September.
The current economic conditions index held roughly unchanged from December. A decline in buying conditions for large household goods, presumably due to weak income gains, offset a rise in the view of current personal finances to the highest level since September. The figure did, however, remain off sharply from last year's average.
The opinion of government policy, which apparently influences economic expectations, fell to the series' low (-35.9% y/y). Only six percent of respondents thought that a good job was being done by government and a record fifty-six percent thought that a poor job was being done.
Inflation expectations ticked slightly higher to 2.5% during the next year but that remained near the series' low. It was as high as 7.0% in May. The expected inflation rate during the next five years rose off the series' low to 3.7%.
The University of Michigan survey is not seasonally adjusted.The reading is based on telephone interviews with about 500 households at month-end; the mid-month results are based on about 300 interviews. The summary indexes are in Haver's USECON database, with details in the proprietary UMSCA database.
| University of Michigan | Mid-January | December | November | January y/y | 2008 | 2007 | 2006 |
|---|---|---|---|---|---|---|---|
| Consumer Sentiment | 61.9 | 60.1 | 55.3 | -21.0% | 63.8 | 85.6 | 87.3 |
| Current Conditions | 69.2 | 69.5 | 57.5 | -26.7 | 73.7 | 101.2 | 105.1 |
| Expectations | 57.2 | 54.0 | 53.9 | -16.0 | 57.3 | 75.6 | 75.9 |

Tom Moeller
AuthorMore in Author Profile »Prior to joining Haver Analytics in 2000, Mr. Moeller worked as the Economist at Chancellor Capital Management from 1985 to 1999. There, he developed comprehensive economic forecasts and interpreted economic data for equity and fixed income portfolio managers. Also at Chancellor, Mr. Moeller worked as an equity analyst and was responsible for researching and rating companies in the economically sensitive automobile and housing industries for investment in Chancellor’s equity portfolio. Prior to joining Chancellor, Mr. Moeller was an Economist at Citibank from 1979 to 1984. He also analyzed pricing behavior in the metals industry for the Council on Wage and Price Stability in Washington, D.C. In 1999, Mr. Moeller received the award for most accurate forecast from the Forecasters' Club of New York. From 1990 to 1992 he was President of the New York Association for Business Economists. Mr. Moeller earned an M.B.A. in Finance from Fordham University, where he graduated in 1987. He holds a Bachelor of Arts in Economics from George Washington University.
More Economy in Brief


