 Global| Nov 19 2008
U.S. CPI Fell A Record 1.0% and Core Prices Declined As Well
by:Tom Moeller
|in:Economy in Brief
Summary
The consumer price index (CPI-U) fell a record 1.0% last month versus September, according to the Bureau of Labor Statistics. The decline followed a roughly unchanged figure and it about matched Consensus expectations for a 0.8% [...]
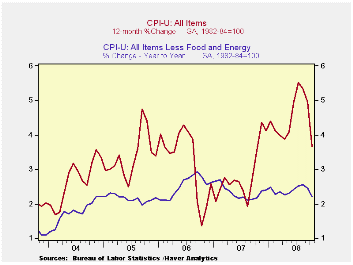
The consumer price index (CPI-U) fell a record 1.0% last month versus September, according to the Bureau of Labor Statistics. The decline followed a roughly unchanged figure and it about matched Consensus expectations for a 0.8% decline. The latest reading lowered the three-month rate of change to 4.4% (AR).
Lower energy prices accounted for most of
the decline in the total as they fell 8.6% from September. The drop was
led by a record 14.2% drop in gasoline prices (+12.0% y/y) to an
average of $3.05 per gallon. Prices have moved even lower this month to
$2.07. Fuel oil prices fell a sharp 8.8% (+21.7% y/y), down for the
third straight month. Prices for natural gas & electricity fell
just slightly m/m (+9.8% y/y).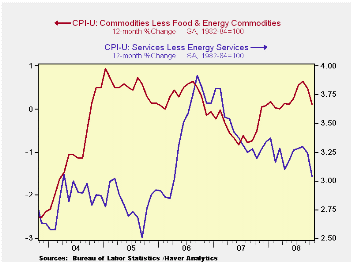
Food & beverage prices increased 0.3%, half the September rise and the weakest gain since March. For the bulk of the year, however, food prices have been quite strong. They have posted a 6.1% y/y increase, the fastest since early 1990. September prices for cereals & bakery products and meats, poultry & fish remained firm, each up 0.6%. Year-to-year, they have increased 12.5% y/y and 6.2% y/y, respectively.
The CPI less food & energy fell 0.1%, the first decline since late 1982. Consensus expectations were for a 0.2% increase. The three-month annual rate of increase fell to 1.1% from its July high of 3.5%.
Core goods prices fell by 0.2%, the second consecutive monthly drop. The three-month rate of decline amounted to 1.9%, the weakest since late 2006. The latest decline was led again by lower prices for new & used motor vehicles which were down another 0.7% (-2.3% y/y). Apparel prices also fell by a sharp 1.0% (+0.3% y/y). Apparel prices fell 0.4% last year. Prices for household furnishings & operations were unchanged (+2.0% y/y). Continued strength was seen in tobacco prices which rose 0.4% (7.0% y/y).
Core services prices were unchanged, their weakest performance since 1982. The three-month growth rate eased to 2.2%, the lowest since April. Medical care services prices rose just 0.2% (3.4% y/y) while education costs remained firm and gained another 0.4% (5.9% y/y). Shelter prices were unchanged (+2.2% y/y) as the housing market remained depressed, the weakest y/y gain since mid-2005. Owners equivalent rent of primary residence, a measure not equivalent to other house price measures, ticked up 0.1% (2.3% y/y). Rents remained firm and rose by 0.4% (3.7% y/y). Public transportation prices fell for the second consecutive month. The 3.3% decline nevertheless left them up 8.4% y/y. Recreation prices ticked 0.1% higher (2.2% y/y).
The chained CPI, which adjusts for shifts in consumption patterns, fell 0.8%. Less food and energy, chained prices ticked up just 0.1%.
| Consumer Price Index (%) | October | September | Y/Y | 2007 | 2006 | 2005 |
|---|---|---|---|---|---|---|
| Total | -1.0 | -0.1 | 3.7 | 2.9 | 3.2 | 3.4 |
| Total less Food & Energy | -0.1 | 0.1 | 2.2 | 2.3 | 2.5 | 2.2 |
| Goods less Food & Energy | -0.4 | -0.2 | 0.1 | -0.4 | 0.2 | 0.5 |
| Services less Energy | 0.0 | 0.3 | 3.0 | 3.4 | 3.4 | 2.8 |
| Energy | -8.6 | -1.9 | 11.6 | 5.6 | 11.0 | 17.0 |
| Food & Beverages | 0.3 | 0.6 | 6.1 | 3.9 | 2.3 | 2.5 |
| Chained CPI: Total (NSA) | -0.8 | -0.1 | 3.3 | 2.5 | 2.9 | 2.9 |
| Total less Food & Energy | 0.1 | 0.2 | 1.9 | 2.0 | 2.2 | 1.9 |
by Tom Moeller November 19, 2008
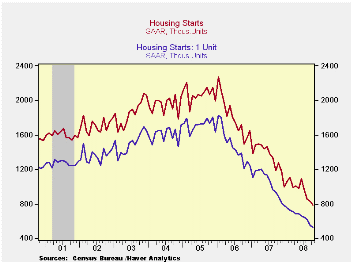
Housing starts fell to a record low last month. At 791,000 units (SAAR), the level was the lowest in the series' history which dates back to 1959. The 4.5% decline followed a revised 3.0% September drop that was slightly shallower than reported initially. Consensus expectations had been for 780,000 starts.
Starts of single-family homes fell another 3.3% to 531,000 units, their lowest level since late-1981. Since their peak in early 2006, single-family starts are down by roughly two-thirds. Permits to build single family homes also fell 14.5% (-43.3% y/y) to 460,000, their lowest since the 1981-82 recession.
Starts began 4Q down 11.9% from the 3Q average. During the last ten years there has been an 84% correlation between the q/q change in single-family starts and their contribution to quarterly GDP growth.
October multi-family starts fell 6.8% from September and they are down by one-third from last year.
By region, October starts of single-family units in the Northeast were unchanged m/m but down 40.6% y/y. In the Midwest starts rose 11.5% but they remained 42.9% lower than last October. In the South single-family starts fell a hard 10.5% (-40.6% y/y) to their lowest since 1990 while in the West starts ticked up 1.7% (-35.1% y/y) after a 13.9% September decline.
Today's speech Monetary Policy and Asset Prices Revisited by Fed Vice-Chairman Donald L. Kohn can be found here.
| Housing Starts (000s, SAAR) | October | September | August | Y/Y | 2007 | 2006 | 2005 |
|---|---|---|---|---|---|---|---|
| Total | 791 | 828 | 854 | -38.0% | 1,341 | 1,812 | 2,073 |
| Single-Family | 531 | 549 | 615 | -39.9 | 1,034 | 1,474 | 1,719 |
| Multi-Family | 260 | 279 | 239 | -33.5 | 307 | 338 | 354 |
| Building Permits | 708 | 805 | 857 | -40.1 | 1,389 | 1,844 | 2,160 |
by Robert Brusca November 19, 2008
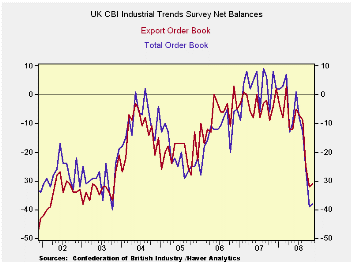
UK orders rebounded ever so slightly from last month’s extreme
weakness and still reside in the bottom 2% of their range since about
2000. Export orders have had the same response, making a token bounce
in November. Stocks of finished goods are rated as at their highest
levels indicating a problem build up with orders falling so fast.
Not surprisingly output volume for the next 3-months is rated
at a net of -42 the weakest reading on record. Prices are still posted
to make gains with a net +10 reading that is still in the top 21% of
its range. So inflation pressures are proving sticky in the face of
horrific weakness. The NTC (Markit) diffusion survey for Nov is not
quite ready but its low readings essentially confirms the deteriorating
picture from the CBI.
| UK Industrial volume data CBI Survey | ||||||||||
|---|---|---|---|---|---|---|---|---|---|---|
| Reported: | Nov 08 |
Oct 08 |
Sep 08 |
Aug 08 |
Jul 08 |
12MO Avg | Pcntle | Max | Min | Range |
| Total Orders | -38 | -39 | -26 | -13 | -8 | -4 | 2% | 9 | -40 | 49 |
| Export Orders | -31 | -32 | -25 | -9 | -7 | -7 | 17% | 3 | -39 | 42 |
| Stocks: FinGds | 25 | 24 | 21 | 18 | 13 | 13 | 100% | 24 | -2 | 26 |
| Looking ahead | ||||||||||
| Output Volume: Nxt 3M | -42 | -31 | -16 | -13 | -7 | 1 | 0% | 28 | -31 | 59 |
| Avg Prices 4Nxt 3m | 10 | 23 | 31 | 34 | 28 | 25 | 79% | 34 | -19 | 53 |
| From end 2000 | ||||||||||
| Compare to CIPS MFG | ||||||||||
| Oct 08 |
Sep 08 |
Aug 08 |
Jul 08 |
12MO Avg | Pcntle | Max | Min | Range | ||
| UK MFG | 41.49 | 41.15 | 45.28 | 44.37 | 48.05 | 2% | 56.3 | 41.15 | 15 | |

Tom Moeller
AuthorMore in Author Profile »Prior to joining Haver Analytics in 2000, Mr. Moeller worked as the Economist at Chancellor Capital Management from 1985 to 1999. There, he developed comprehensive economic forecasts and interpreted economic data for equity and fixed income portfolio managers. Also at Chancellor, Mr. Moeller worked as an equity analyst and was responsible for researching and rating companies in the economically sensitive automobile and housing industries for investment in Chancellor’s equity portfolio. Prior to joining Chancellor, Mr. Moeller was an Economist at Citibank from 1979 to 1984. He also analyzed pricing behavior in the metals industry for the Council on Wage and Price Stability in Washington, D.C. In 1999, Mr. Moeller received the award for most accurate forecast from the Forecasters' Club of New York. From 1990 to 1992 he was President of the New York Association for Business Economists. Mr. Moeller earned an M.B.A. in Finance from Fordham University, where he graduated in 1987. He holds a Bachelor of Arts in Economics from George Washington University.
More Economy in Brief


