 Global| Mar 18 2011
U.S. Consumers Like To Play
by:Tom Moeller
|in:Economy in Brief
Summary
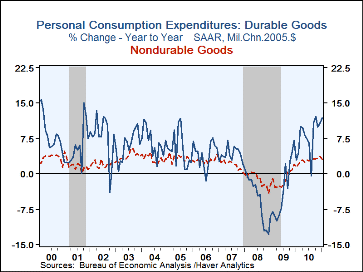
When income is tight, consumers spend less. When they look for what to cut back on, hardest hit are automobiles, electronics and furniture. And when incomes improve, these items bounce back strongly. That's the message from the table [...]
When income is tight, consumers spend less. When they look for what to cut back on, hardest hit are automobiles, electronics and furniture. And when incomes improve, these items bounce back strongly. That's the message from the table below indicating 11.9% growth in real purchases of durable goods as of this January versus the sharp cutbacks in 2008 and 2009. Spending on nondurable goods shows some volatility, rising 3.0% of late versus the 1.2% 2009 cutback, but its less since food and clothing purchases aren't easily delayed.
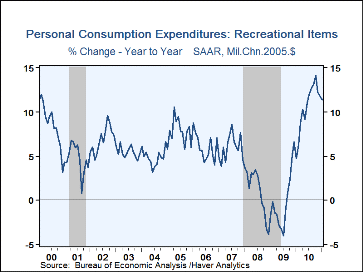
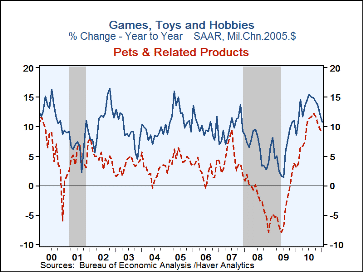
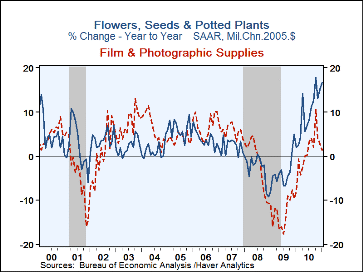
Purchases of recreational items similarly aren't immune to income cycles, but their relatively low expense makes them far less sensitive. When real income rose just 0.6% in 2009, durables purchases fell 3.7% but recreational items fell just 0.2%. That decline came at the expense of far fewer pet purchases and less gardening. Yet individuals stayed home and played more games or developed hobbies. Notable, however, is the volatility of film & photographic supplies. The digital revolution just crushed purchases by 12.7% in 2009.
As income improved over the last year, it's impressive that recreational spirits were unleashed to a degree that roughly matched the increase in durable goods purchases. Spending on durable goods rose 11.9% y/y as of January while sales of recreational items rose 11.4%. Leading the leisure spirit was a 16.6% gain in gardening supplies and a 10.8% increase in games, toys & hobbies. With respect to film purchases, it's a wonder they recovered as much as 1.4%. Going forward, as overall unemployment lingers in double-digits, it's possible that consumer income growth will lag past cycles. Add to that the aging demographics of America, the spirit to recreate will continue strong.
The detailed PCE figures are available in Haver's USNA database.
Life-Cycle Shocks and Income from the Federal Reserve Bank of San Francisco is available here.
| Real Income & Outlays (Y/Y %) | Jan | Dec | Nov | 2010 | 2009 | 2008 |
|---|---|---|---|---|---|---|
| Disposable Personal Income | 2.7 | 2.1 | 2.3 | 1.4 | 0.6 | 1.7 |
| Personal Consumption | 2.8 | 2.7 | 2.7 | 1.8 | -1.2 | -0.3 |
| Durable Goods | 11.9 | 10.7 | 10.0 | 7.6 | -3.7 | -5.2 |
| Nondurable Goods | 3.0 | 3.7 | 3.3 | 2.8 | -1.2 | -1.1 |
| Recreational Items | 11.4 | 11.8 | 12.2 | 10.5 | -0.2 | 1.1 |
| Games, Toys & Hobbies | 10.8 | 12.1 | 13.7 | 13.3 | 6.2 | 6.3 |
| Pets and related products | 8.9 | 9.6 | 10.5 | 8.8 | -3.6 | -1.9 |
| Flowers, seeds & potted plants | 16.6 | 15.1 | 13.0 | 9.5 | -3.8 | -2.7 |
| Film & photographic supplies | 1.4 | 2.6 | 4.1 | 0.8 | -12.7 | -1.5 |
Tom Moeller
AuthorMore in Author Profile »Prior to joining Haver Analytics in 2000, Mr. Moeller worked as the Economist at Chancellor Capital Management from 1985 to 1999. There, he developed comprehensive economic forecasts and interpreted economic data for equity and fixed income portfolio managers. Also at Chancellor, Mr. Moeller worked as an equity analyst and was responsible for researching and rating companies in the economically sensitive automobile and housing industries for investment in Chancellor’s equity portfolio. Prior to joining Chancellor, Mr. Moeller was an Economist at Citibank from 1979 to 1984. He also analyzed pricing behavior in the metals industry for the Council on Wage and Price Stability in Washington, D.C. In 1999, Mr. Moeller received the award for most accurate forecast from the Forecasters' Club of New York. From 1990 to 1992 he was President of the New York Association for Business Economists. Mr. Moeller earned an M.B.A. in Finance from Fordham University, where he graduated in 1987. He holds a Bachelor of Arts in Economics from George Washington University.


