 Global| Aug 26 2005
U.S. Consumer Sentiment Drops Further in Final August Report
Summary
The University of Michigan Index of Consumer Sentiment for August was revised markedly in the final report issued this morning. Forecasters, already surprised by a decrease of 3.8 points in the preliminary figure, expected that level [...]
The University of Michigan Index of Consumer Sentiment for August was revised markedly in the final report issued this morning. Forecasters, already surprised by a decrease of 3.8 points in the preliminary figure, expected that level of 92.7 to hold for the month's final. But it came at 89.1, down 3.6 points more for a total drop in the month of 7.4 points. Normally there is little change from the preliminary to the final readings for a given month.
The index of current conditions was adjusted downward 2.2 points from the preliminary to put the entire month at 108.2, off 5.3 points from July. The index of consumer expectations came down another 4.4 points to 76.9, down 8.6 points from July.
The indexes are lower from July for both income brackets, below $50,000 and above $50,000, all four major Census regions of the country and all age groups.
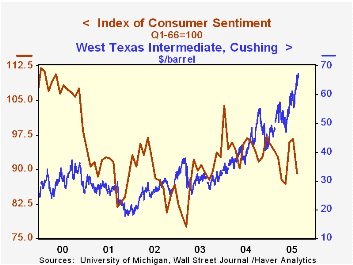
Two weeks ago in this space, Tom Moeller graphed the total index with the price of crude oil. The energy price situation has worsened noticeably since then, and we'd surmise, without much esoteric econometric analysis, that people are reacting negatively to the resulting record gasoline prices. A summary of those developments is contained in a separate story following.
The University of Michigan survey is not seasonally adjusted.The mid-month survey is based on telephone interviews with 250 households nationwide on personal finances and business and buying conditions. The survey is expanded to a total of 500 interviews at month end.
| University of Michigan | August (final) | August (prel) | July | Y/Y | 2004 | 2003 | 2002 |
|---|---|---|---|---|---|---|---|
| Consumer Sentiment | 89.1 | 92.7 | 96.5 | -7.1% | 95.2 | 87.6 | 89.6 |
| Current Conditions | 108.2 | 110.4 | 113.5 | 0.3% | 105.6 | 97.2 | 97.5 |
| Consumer Expectations | 76.9 | 81.3 | 85.5 | -12.8% | 88.5 | 81.4 | 84.6 |
by Carol Stone August 26, 2005

Perhaps it's not necessary to document energy prices so, ah, graphically. But their changes have been dramatic, and the reaction of the University of Michigan Consumer Sentiment survey (see above) is probably just the first obvious sign of their impact in a piece of economic data. "Employee discount" pricing by several major auto manufacturers is another response, as those firms seek to clear stocks particularly of larger, less gas- efficient models.
Gasoline demand has been strong. In our second graph, we show Department of Energy data on weekly gasoline consumption; this is contained in Haver's OILWKLY database, compiled and provided to us by the "Oil & Gas Journal". In this DLXVG3 graph, we've used the lead-lag feature to shift the series back one year so as to compare weekly seasonal patterns. Earlier years saw a clear spike in gasoline consumption at about this time of the summer, a sharp rise followed by just as rapid a drop in early September. But 2004 was an exception, as you can see from different shape of the lagged curve compared with the "normal" development in 2003; consumption rose earlier in the season and stayed high all summer long before spiking and then dropping back in the autumn. But, over the winter, demand didn't fall as much as it had previously. This year, starting from a higher base, spring demand gained and has since sustained still higher volume over many weeks -- despite the surging cost.
Another non-traditional development this summer has been an extraordinary rise in natural gas prices. Called to our attention by an ordinary news article in the Wall Street Journal, the recent surge in those prices is unprecedented. While some summers have seen a slight rise in August, previous experiences like this year's sharp price increase have only come in the winter, when heating demand is great. The Journal attributed this to a "hot summer" eliciting more electricity output from gas-fired power plants. Our casual examination of recent temperature patterns suggests that through July, this summer has not been especially hot, and this theory seems to bear more investigation.
The recent sizable energy price advances look likely to cause consumers and businesses to alter their budgetary priorities, and as we noted at the outset, the drop in consumer sentiment may be an early concrete signal that consumers realize they will have to implement such changes.
| Energy Prices | 8/25 | 8/24 | 8/19 | 7/25 | 2004 | 2003 | 2002 |
|---|---|---|---|---|---|---|---|
| Crude Oil - WTI ($/barrel) | 67.30 | 67.08 | 65.36 | 56.01 | 41.31 | 31.14 | 25.92 |
| Natural Gas - Henry Hub ($/MMBTU) | 9.68 | 9.98 | 9.32 | 7.43 | 5.869 | 5.504 | 3.348 |
| Gasoline - Retail ($/gal) | 2.612 (wk-8/22) | 2.289 (wk-7/25) | 1.880 | 1.591 | 1.358 |
Carol Stone, CBE
AuthorMore in Author Profile »Carol Stone, CBE came to Haver Analytics in 2003 following more than 35 years as a financial market economist at major Wall Street financial institutions, most especially Merrill Lynch and Nomura Securities. She had broad experience in analysis and forecasting of flow-of-funds accounts, the federal budget and Federal Reserve operations. At Nomura Securities, among other duties, she developed various indicator forecasting tools and edited a daily global publication produced in London and New York for readers in Tokyo. At Haver Analytics, Carol was a member of the Research Department, aiding database managers with research and documentation efforts, as well as posting commentary on select economic reports. In addition, she conducted Ways-of-the-World, a blog on economic issues for an Episcopal-Church-affiliated website, The Geranium Farm. During her career, Carol served as an officer of the Money Marketeers and the Downtown Economists Club. She had a PhD from NYU's Stern School of Business. She lived in Brooklyn, New York, and had a weekend home on Long Island.
More Economy in Brief


