 Global| May 08 2008
U.S. Consumer Credit Growth Up in March, Stable With 2007
by:Tom Moeller
|in:Economy in Brief
Summary
Consumer credit outstanding rose $15.3B during March after an upwardly revised $6.6B February increase. The gain was more than twice the rise that was generally expected. On a percentage basis, the change in consumer credit over the [...]
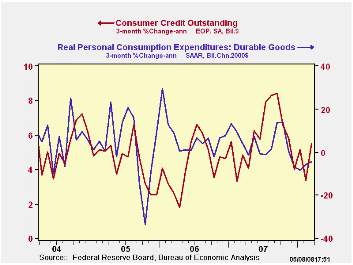
Consumer credit outstanding rose $15.3B during March after an upwardly revised $6.6B February increase. The gain was more than twice the rise that was generally expected.
On a percentage basis, the change in consumer credit over the
last three months averaged 5.5% (AR), about the same as during all of
2007.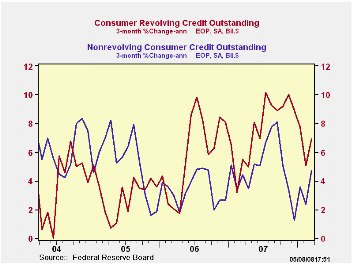
Revolving credit outstanding rose $6.3B, nearly twice the February increase. The three month growth rate, however, fell slightly to 6.9% from 7.5% last year.
Non-revolving credit, which accounts for nearly two thirds of total consumer credit, increased more sharply last month by $9.0B after an upwardly revised $2.6B February gain. The three month annualized average growth rate, however, was stable with last year's 4.7% increase though that was up from a 1.2% low at the end of last year.
These figures are the major input to the Fed's Flow of Funds accounts for the household sector, released quarterly.
The Recession Dating Procedure from the National Bureau of Economic Research (NBER) can be found here.
| Consumer Credit (m/m Chg, SAAR) | March | February | Y/Y | 2007 | 2006 | 2005 |
|---|---|---|---|---|---|---|
| Total | $15.3B | $6.6B | 5.9% | 5.7% | 4.5% | 4.3% |
| Revolving | $6.3B | $3.9B | 7.9% | 7.5% | 6.1% | 3.1% |
| Non-revolving | $9.0B | $2.6B | 4.7% | 4.7% | 3.6% | 4.9% |
by Tom Moeller May 8, 2008
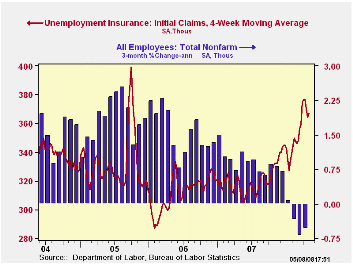
Last week's initial claims for unemployment insurance continued the recent up/down pattern, with an upward drift, of the last several periods. They fell by 18,000 to 365,000 after an upwardly revised 38,000 increase during the prior week. Consensus expectations had been for claims to total 375,000 last week.
The four week moving average of initial claims rose slightly
week-to-week to 367,000 (17.0% y/y) after claims averaged 365,000
during April.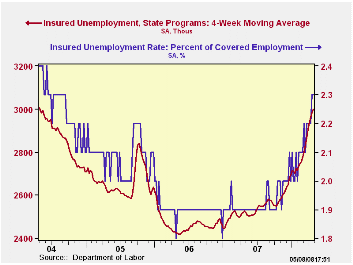
A claims level below 400,000 typically has been associated with growth in nonfarm payrolls. During the last ten years there has been a (negative) 76% correlation between the level of initial claims and the m/m change in nonfarm payroll employment.
Continuing claims for unemployment insurance fell 10,000 after an upwardly revised 84,000 worker increase during the prior week. The latest level was near its highest since early 2004 and it provides some indication of workers' ability to find employment.
The continuing claims numbers lag the initial claims figures by one week.
Initial claims for the week ended April 26 increased the most in Massachusetts, New York, Kentucky, New Jersey and Michigan. The largest decreases occurred in Texas, Rhode Island, California, Pennsylvania and Connecticut.
The insured rate of unemployment held steady at 2.3% for the second week. The latest also was the highest since 2004.
Mitigating the Impact of Foreclosures on Neighborhoods is yesterday's speech by Fed Governor Randall Kroszner and it is available here.
| Unemployment Insurance (000s) | 05/03/08 | 04/26/08 | Y/Y | 2007 | 2006 | 2005 |
|---|---|---|---|---|---|---|
| Initial Claims | 365 | 383 | 22.9% | 322 | 313 | 331 |
| Continuing Claims | -- | 3,020 | 19.4% | 2,552 | 2,459 | 2,662 |
by Robert Brusca May 8, 2008
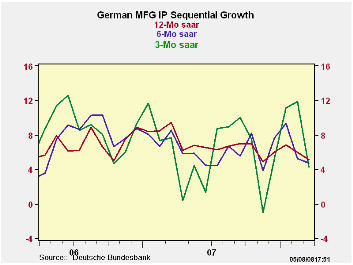
The chart on top shows that German growth trends are decaying across the array of 3-Mo 6-Mo and 12-Mo rates. They are stratified so that the they do point to some further decelerations but only barely. Each growth rate series has a declining profile coming into the current month. Even so on each horizon the rate of growth is still close to 4.0%, which for real output is still a fairly strong result.
Underneath the headlines we find that the trends and underpinnings are notas bullet-proof. The trend for the output of consumer goods is withering steadily with a three-month rate of growth that is -1.1%. Capital goods output trends are accelerated with a 3-month growth rate 0f 7.5%. But intermediate goods growth has been decelerating steadily. The capital goods result, while quite solid-looking on its own should be looked upon with some suspicion since the rate of the E-zone is slowing and capital goods investment generally gets cut back in economic slowdowns. Clearly German IP trends tell us that the consumer that Germany sells to are being less than resilient.
Short term, however, trends are still quite bright. In 2008-Q1 all main (annualized) sector growth rates are at 3% or higher. Moreover the quarter shows growth accelerations from the previous quarter for output in consumer goods, capital goods and intermediate goods. Growth rates per se are strong in the quarter: For capital goods the q/q annualized rate of growth is 11.7% and for intermediate goods it is 9.2%. These figures exceed their current trend values and imply that Q1 GDP might overstate the developing trend.
Construction is up at a 49% pace in the quarter MFG IP is up at a 9% pace but MFG orders are falling by 5.3%, one of the ominous signals for growth ahead – but ahead of 2008Q1.
| Total German IP | |||||||
|---|---|---|---|---|---|---|---|
| Saar exept m/m | Mar-08 | Feb-08 | Jan-08 | 3-mo | 6-mo | 12-mo | Quarter-to-Date |
| IP total | -0.5% | 0.2% | 1.4% | 4.4% | 4.1% | 4.6% | 9.6% |
| Consumer goods | 0.5% | -0.8% | 0.0% | -1.1% | -1.3% | 0.5% | 3.0% |
| Capital goods | -1.8% | -0.7% | 4.5% | 7.5% | 5.9% | 6.4% | 11.7% |
| Intermediate goods | 1.1% | 1.2% | -1.3% | 3.8% | 6.4% | 6.3% | 9.2% |
| Memo | |||||||
| Construction | -12.3% | 3.1% | 11.4% | 2.9% | 2.4% | -4.0% | 49.1% |
| MFG IP | -0.2% | 0.0% | 1.2% | 4.2% | 4.8% | 5.2% | 9.0% |
| MFG Orders | -0.6% | -0.6% | -0.7% | -7.2% | 6.0% | 5.1% | -5.3% |
by Robert Brusca May 8, 2008
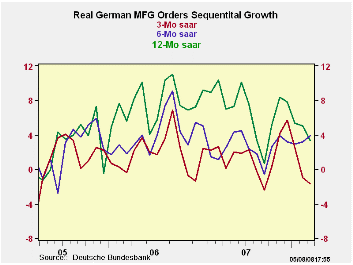
German orders have taken some time to weaken since the euro began climbing strongly. Arguably it is now a plethora of factors that are dogging the trend including the strong euro but also the fallout from the financial turmoil and the transmission of weakness from faltering growth in the US and elsewhere – to extent that theses things are different.
Orders both domestic and foreign have eased their pace from their year ago growth rate and also sequentially through six-month and three-month growth rates as well. Both domestic and foreign orders have decelerated their pace. The quarterly readings show negative growth rates for both domestic and foreign orders in 2008-Q1.
But this slowing has yet to hit the pace of sales. Sales growth rates are still largely rising except for consumer goods –long the Achilles Heel of this expansion. Capital goods sales have slowed but are still strong in the Q1 period. Intermediate goods sales remain relatively robust.
On balance the orders figure that tend to lead the cycle show that he boom days in MFG are coming to a close. Since they are slowing sharply and since growth rates have turned negative, they hint that the slowdown could be severe.
| German Orders and Sales By Sector and Origin | ||||||||
|---|---|---|---|---|---|---|---|---|
| Real and SA | % M/M | % Saar | ||||||
| Mar-08 | Feb-08 | Jan-08 | 3-Mo | 6-Mo | 12-Mo | Yr Ago | QTR-2-Date | |
| Total Orders | -0.6% | -0.6% | -0.7% | -7.2% | -3.6% | 5.1% | 11.5% | -5.3% |
| Foreign | -0.4% | -1.1% | -0.4% | -7.6% | -3.9% | 6.8% | 12.7% | -9.6% |
| Domestic | -0.9% | 0.0% | -0.9% | -6.6% | -3.4% | 3.3% | 10.4% | -0.2% |
| Sector Sales | ||||||||
| MFG/Mining | -0.5% | -0.2% | 2.1% | 5.9% | 2.9% | 4.6% | 9.3% | 9.2% |
| Consumer Goods | 0.2% | -1.8% | 1.0% | -2.3% | -1.1% | -0.7% | 5.6% | -1.0% |
| Consumer Durables | -0.9% | -0.3% | 0.8% | -1.6% | -0.8% | 0.4% | 5.1% | 4.3% |
| Consumer Nondurables | 0.4% | -2.0% | 1.1% | -2.2% | -1.1% | -0.9% | 5.9% | -2.0% |
| Capital Goods | -2.7% | -0.8% | 4.2% | 2.7% | 1.3% | 5.4% | 9.7% | 10.9% |
| Intermediate Goods | 1.9% | 1.6% | 0.2% | 15.5% | 7.5% | 6.7% | 11.2% | 13.2% |
| All Manufacturing Sales | -0.5% | -0.2% | 2.1% | 5.7% | 2.8% | 4.1% | 9.3% | 9.1% |

Tom Moeller
AuthorMore in Author Profile »Prior to joining Haver Analytics in 2000, Mr. Moeller worked as the Economist at Chancellor Capital Management from 1985 to 1999. There, he developed comprehensive economic forecasts and interpreted economic data for equity and fixed income portfolio managers. Also at Chancellor, Mr. Moeller worked as an equity analyst and was responsible for researching and rating companies in the economically sensitive automobile and housing industries for investment in Chancellor’s equity portfolio. Prior to joining Chancellor, Mr. Moeller was an Economist at Citibank from 1979 to 1984. He also analyzed pricing behavior in the metals industry for the Council on Wage and Price Stability in Washington, D.C. In 1999, Mr. Moeller received the award for most accurate forecast from the Forecasters' Club of New York. From 1990 to 1992 he was President of the New York Association for Business Economists. Mr. Moeller earned an M.B.A. in Finance from Fordham University, where he graduated in 1987. He holds a Bachelor of Arts in Economics from George Washington University.
More Economy in Brief


