 Global| Feb 08 2008
U.S. Consumer Credit Growth Eased in December but Accelerated in 2007
by:Tom Moeller
|in:Economy in Brief
Summary
At an annual rate consumer credit grew 2.2% during December, down sharply from the revised 8.5% jump in November. For all of last year, however, credit growth picked up slightly to 5.5% from 4.5% in 2006. In fact growth last year was [...]
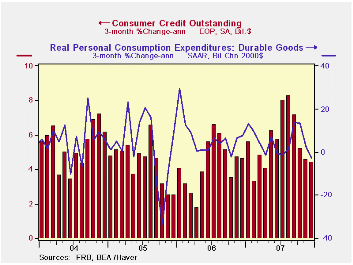
At an annual rate consumer credit grew 2.2% during December, down sharply from the revised 8.5% jump in November. For all of last year, however, credit growth picked up slightly to 5.5% from 4.5% in 2006. In fact growth last year was the quickest since 2004. (The annual rates of growth equal the Dec/Dec percent because the figures are "end of period.")
Continuing to indicate the slowdown in consumer spending was
the three month change in credit. It fell to 4.4% which was
nearly half the growth rate of this past August.The credit
slowdown has been accompanied by slower three-month growth in real
consumer spending on durable goods, to -2.8% thru December versus +4.8%
for all of last year.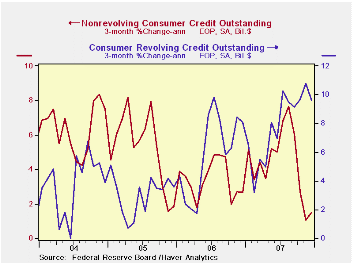
Non-revolving credit, which accounts for nearly two thirds of the total, grew a slower 1.8% in December versus November. The three month growth rate remained quite low at 1.5% versus a peak of 7.7% in August.
Growth in revolving credit also slowed considerably to 2.7% (AR) in December from 14.7% in November. That slowdown left the three month growth rate at a somewhat firm 9.6%.
These figures are the major input to the Fed's Flow of Funds accounts for the household sector, released quarterly.
The Recession Dating Procedure from the National Bureau of Economic Research (NBER) can be found here.
| Consumer Credit (m/m Chg, SAAR) | December | November | Y/Y | 2007 | 2006 | 2005 |
|---|---|---|---|---|---|---|
| Total | 2.2% | 8.5% | 5.5% | 5.5% | 4.5% | 4.3% |
| Revolving | 2.7 | 14.7 | 7.8 | 7.8 | 6.1 | 3.1 |
| Non-revolving | 1.8 | 5.0 | 4.2 | 4.2 | 3.6 | 4.9 |
by Robert Brusca February 8, 2008
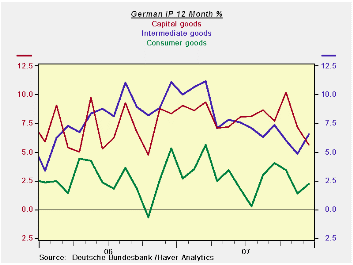
German output shows signs of slowing. The sequential growth
rates in the table demonstrate that growth has slowed steadily from
12-mos to 6-mos to 3-mos. Output of consumer goods, weak over the
entire period has weakened further in the recent three months. Capital
goods output, long the strength of German manufacturing is showing some
clear signs of weaker growth. Oddly, against that back drop the output
of intermediate goods has ramped up.
For the quarter output is up a solid 2.2%, but that is down
sharply from over 8% in Q3. For the quarter the sectors are mostly
solid, with weakness in the output of construction goods being the weak
exception.
| Total German IP | |||||||
|---|---|---|---|---|---|---|---|
| Saar except m/m | Dec-07 | Nov-07 | Oct-07 | 3-mo | 6-mo | 12-mo | Quarter to-Date |
| IP total | 0.8% | -0.3% | -0.2% | 1.4% | 4.7% | 4.3% | 2.2% |
| Consumer Goods | 2.3% | -1.2% | -0.9% | 0.4% | 6.4% | 2.2% | 1.7% |
| Capital Goods | -2.0% | 0.2% | 1.5% | -1.5% | 3.5% | 5.6% | 5.0% |
| Intermediate Goods | 3.2% | -0.2% | -0.9% | 8.8% | 8.4% | 6.5% | 2.9% |
| Memo | |||||||
| Construction | 0.9% | -0.2% | -1.5% | -3.4% | 3.3% | -5.6% | -2.6% |
| Manufacturing IP | 0.9% | -0.2% | 0.0% | 3.0% | 6.1% | 5.3% | 3.4% |
| Manufacturing Orders | -1.7% | 3.0% | 4.0% | 22.5% | -2.0% | 10.2% | 21.2% |
by Robert Brusca February 8, 2008
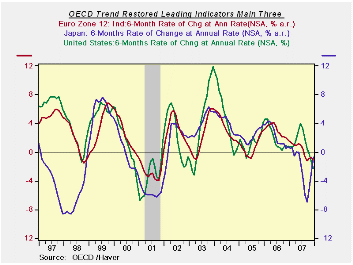
The OECD indices sure do look like ‘slowdown’ but with the
exception of Japan, the indicated weakness is not yet that severe. In
the case of Japan, while the OECD reading had been severe, its low
point has passed as Japan’s signal now points to recovery, diminishing
the sour signal. Over the preferred horizon to view these indicators,
six months, it is the US that is weakest in this grouping.
With the G-7 meeting this weekend there is not much cheer from
theses indicators. While the OECD measures have Japan on the mend,
Japan’s own domestic yardsticks are still producing increasingly weak
readings for some of its preferred cyclical measures.
| OECD Leading Indicators by Main regions/countries | ||||||
|---|---|---|---|---|---|---|
| Dec-07 | Nov-07 | Oct-07 | 3-Mo | 6-Mo | 12-Mo | |
| OECD | -0.2% | -0.1% | 0.1% | -0.7% | -2.8% | -0.2% |
| OECD 7 | -0.3% | -0.1% | 0.0% | -1.7% | -4.0% | -1.8% |
| OECD Europe | -0.2% | 0.1% | 0.1% | -0.1% | -2.1% | -1.3% |
| OECD Japan | 1.1% | 1.0% | 0.5% | 11.0% | -1.9% | -3.9% |
| OECD US | -0.6% | -0.5% | -0.2% | -5.0% | -5.0% | -0.8% |
by Robert Brusca February 8, 2008
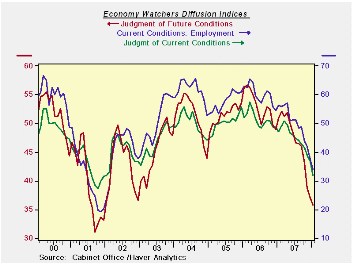
Japan’s Economy watchers Index and the Teikoku Indices show
the weakest economic readings in five years. The economy watchers
indices are down to values of around 30 to 36. And while they are the
weakest we have seen in 5 years they are also approaching some of their
weakest readings ever. The future index is particularly grim. While the
OECD format (though Dec) shows the Japan trend restored LEIs as having
turned the corner and headed up, the economy watchers indices show the
economy still looking for a bottom. The Teikoku readings agree with the
economy watchers indices and see weakness right across the board that
was bad in December and got worse in January.
| Key Japanese surveys | |||||||
|---|---|---|---|---|---|---|---|
| Raw readings of each survey | Percent of 5Yr range* | ||||||
| Diffusion | Jan-08 | Dec-07 | Nov-07 | Oct-07 | Jan-08 | Dec-07 | Nov-07 |
| Economy Watchers | 31.8 | 36.6 | 38.8 | 41.5 | 0.0% | 5.0% | 15.1% |
| Employment | 34.1 | 37.5 | 41.9 | 43.8 | 0.0% | 0.0% | 14.7% |
| Future | 35.8 | 37.0 | 38.8 | 43.1 | 0.0% | 1.5% | 10.6% |
| NTC MFG | 52.4 | 52.3 | 50.8 | 49.5 | 47.4% | 47.3% | 30.2% |
| Econ Trends (Teikoku'/50 neutral/weighted diffusion) | |||||||
| Manufacturing | 37.9 | 40.8 | 41.7 | 42.4 | 0.0% | 0.0% | 9.7% |
| Retail | 31.3 | 34.2 | 34.4 | 37.2 | 0.0% | 0.0% | 0.0% |
| Wholesale | 34.5 | 37.0 | 38.3 | 39.1 | 0.0% | 0.0% | 0.0% |
| Services | 40.4 | 43.5 | 45.0 | 45.6 | 0.0% | 20.1% | 36.4% |
| Construction | 28.9 | 32.0 | 32.6 | 34.7 | 0.0% | 16.4% | 22.8% |
| 100 is high; Zero is low | |||||||

Tom Moeller
AuthorMore in Author Profile »Prior to joining Haver Analytics in 2000, Mr. Moeller worked as the Economist at Chancellor Capital Management from 1985 to 1999. There, he developed comprehensive economic forecasts and interpreted economic data for equity and fixed income portfolio managers. Also at Chancellor, Mr. Moeller worked as an equity analyst and was responsible for researching and rating companies in the economically sensitive automobile and housing industries for investment in Chancellor’s equity portfolio. Prior to joining Chancellor, Mr. Moeller was an Economist at Citibank from 1979 to 1984. He also analyzed pricing behavior in the metals industry for the Council on Wage and Price Stability in Washington, D.C. In 1999, Mr. Moeller received the award for most accurate forecast from the Forecasters' Club of New York. From 1990 to 1992 he was President of the New York Association for Business Economists. Mr. Moeller earned an M.B.A. in Finance from Fordham University, where he graduated in 1987. He holds a Bachelor of Arts in Economics from George Washington University.
More Economy in Brief


