 Global| Dec 30 2008
U.S. Consumer Confidence Fell BackTo A Historic Low
by:Tom Moeller
|in:Economy in Brief
Summary
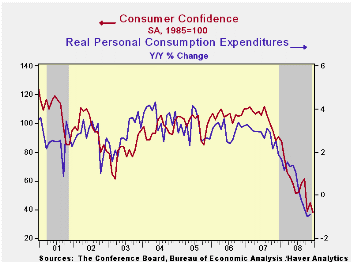
Worry about jobs, income and the future shape of business conditions weighed heavily on consumer psychology. For December, the Conference Board indicated that consumer confidence fell and washed away a slight improvement in November. [...]
 Worry about
jobs, income and the future shape of business conditions weighed
heavily on consumer psychology. For December, the Conference Board
indicated that consumer confidence fell and washed away a slight
improvement in November. The 15.0% month-to-month decline in confidence
was to an index level of 38.0 which was the lowest in the series'
history which extends back to 1967. The decline disappointed Consensus
expectations for a modest improvement in the December index to 45.5.
Worry about
jobs, income and the future shape of business conditions weighed
heavily on consumer psychology. For December, the Conference Board
indicated that consumer confidence fell and washed away a slight
improvement in November. The 15.0% month-to-month decline in confidence
was to an index level of 38.0 which was the lowest in the series'
history which extends back to 1967. The decline disappointed Consensus
expectations for a modest improvement in the December index to 45.5.
During the last ten years there has been a 82% correlation between the level of consumer confidence and the y/y change in real consumer spending.
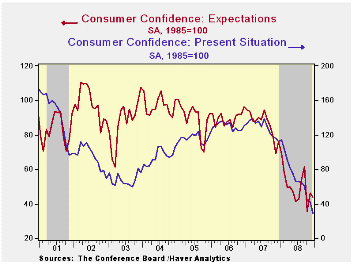
A decline in consumers' reading of current economic conditions was responsible for most of the decline in overall confidence this month. The index measure fell by nearly one-third from the November level and the latest reading was down by three-quarters from last December's figure.
The index of consumers' expectations fell a slight 5.2% month-to-month and it has been relatively stable this year near a historically low level.
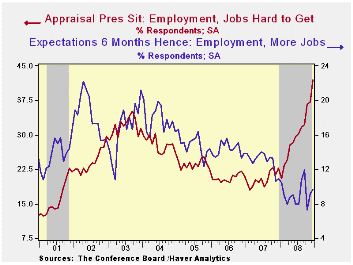
Only 7.7% of respondents thought that business conditions were good and 46.0% thought they were bad, up from 16.2% during all of last year. A gloomy reading of the current job market was notably evident as 42.0% thought that jobs were hard to get, double last year's percentage and up five percentage points just since last month.
Moving somewhat counter to the increase in gloom about the
short-term economy was that 2.5% of respondents planned to buy a home
during the next six months, up from 2.1% in November. The reading was,
however, still near the series' historic low. Also showing
slight m/m improvement were plans to buy an appliance or an automobile,
but both measures also still were near their all time lows.
Expectations for the inflation rate in twelve months fell further 5.8%, the lowest level since February.
The Conference Board figures referenced above are available in Haver's CBDB database.
| Conference Board (SA, 1985=100) | December | November | Y/Y % | 2008 | 2007 | 2006 |
|---|---|---|---|---|---|---|
| Consumer Confidence Index | 38.0 | 44.7 | -58.1 | 57.9 | 103.4 | 105.9 |
| Present Situation | 29.4 | 42.3 | -74.0 | 69.8 | 128.8 | 130.2 |
| Expectations | 43.8 | 46.2 | -42.2 | 49.9 | 86.4 | 89.7 |
by Tom Moeller December 30, 2008
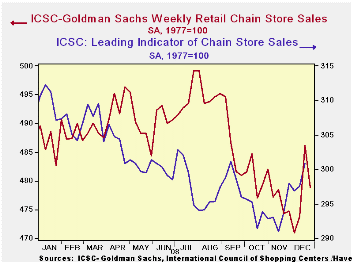
Chain store sales during Christmas week gave nothing to cheer about, according to the International Council of Shopping Centers-Goldman Sachs Index. The level of sales last week fell 1.5% and that reversed about half of the prior week's rise. For the month, December sales did rise but only by a scant 0.3% from the November average. That uptick followed declines of between 1.0% and 1.9% during each of the prior three months.
The year-to-year decline in sales of 1.8% was the weakest performance since early 2003. During the last ten years there has been a 59% correlation between the y/y change in chain store sales and the change in nonauto retail sales less gasoline.The ICSC-Goldman Sachs retail chain-store sales index is constructed using the same-store sales (stores open for one year) reported by 78 stores of seven retailers: Dayton Hudson, Federated, Kmart, May, J.C. Penney, Sears and Wal-Mart.
Perhaps better news on sales are in store. The weekly leading indicator of chain store sales from ICSC-Goldman Sachs jumped another 1.1% after a 0.2% rise during the prior week. And since the lows of several weeks ago the index has recovered 3.4%.
The chain store sales figures are available in Haver's SURVEYW database.
| ICSC-UBS (SA, 1977=100) | 12/27/08 | 12/20/08 | Y/Y | 2008 | 2007 | 2006 |
|---|---|---|---|---|---|---|
| Total Weekly Chain Store Sales | 478.9 | 486.1 | -1.8% | 1.4% | 2.8% | 3.3% |
by Robert Brusca December 30, 2008
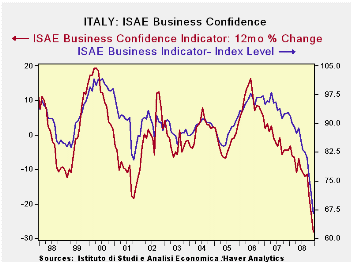
Italian business confidence has been weakening but has now hit extreme proportions. We are day by day getting confirmation that the economic signals are every bit as bad as the worst of our expectations for recession. We are looking at recession forces much more like 1973-75 and 1981-82 than like in 1990 or 2001.
For Italian business, the readings across categories are the worst we have seen since 1996 except for inventories which are not the highest seen but still high readings and clearly into the undesirable range.
Domestic and foreign readings are showing extreme weakness as the year draws to a close.
| Italy ISAE Business Sentiment | ||||||
|---|---|---|---|---|---|---|
| Since Oct 1996 | ||||||
| Dec-08 | Nov-08 | Oct-08 | Sep-08 | Percentile | Rank | |
| Biz Confidence | 66.6 | 71.6 | 76.4 | 81 | 0.0 | 147 |
| TOTAL INDUSTRY | ||||||
| Order books & Demand | ||||||
| Total | -54 | -45 | -38 | -28 | 0.0 | 147 |
| Domestic | -58 | -47 | -39 | -31 | 0.0 | 147 |
| Foreign | -54 | -44 | -33 | -28 | 0.0 | 147 |
| Inventories | 9 | 8 | 6 | 9 | 83.3 | 14 |
| Production | -46 | -37 | -29 | -20 | 0.0 | 147 |
| INTERMEDIATE | ||||||
| Order books & Demand | ||||||
| Total | -68 | -52 | -42 | -31 | 0.0 | 147 |
| Domestic | -69 | -53 | -40 | -33 | 0.0 | 147 |
| Foreign | -67 | -50 | -38 | -32 | 0.0 | 147 |
| Inventories | 7 | 10 | 9 | 8 | 75.9 | 19 |
| Production | -58 | -43 | -29 | -22 | 0.0 | 147 |
| INVESTMENT GOODS | ||||||
| Order books & Demand | ||||||
| Total | -62 | -52 | -39 | -18 | 0.0 | 147 |
| Domestic | -64 | -56 | -44 | -32 | 0.0 | 147 |
| Foreign | -56 | -45 | -27 | -21 | 0.0 | 147 |
| Inventories | 9 | 11 | 6 | 15 | 68.4 | 27 |
| Production | -50 | -41 | -28 | -12 | 0.0 | 147 |
| CONSUMER GOODS | ||||||
| Order books & Demand | ||||||
| Total | -36 | -32 | -33 | -27 | 0.0 | 147 |
| Domestic | -39 | -32 | -34 | -29 | 0.0 | 147 |
| Foreign | -42 | -36 | -32 | -28 | 0.0 | 147 |
| Inventories | 10 | 5 | 3 | 2 | 80.8 | 14 |
| Production | -28 | -27 | -29 | -22 | 2.5 | 146 |
| Total number of months: 147 | ||||||
by Robert Brusca December 30, 2008
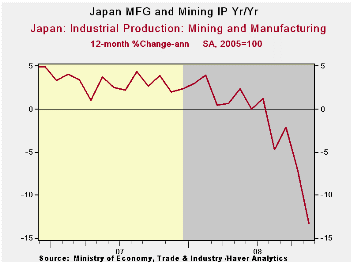
Japan ’s Industrial output fell sharply in November. The 8.1% drop has driven the three-month growth rate to -24% at an annual rate. Declines sweep across the various categories. Transportation is down especially sharply given the trouble in the worldwide auto market.
In the quarter–to-date IP is falling at a 31% annual rate; transportation at a 52% annual rate.
| Japan Industrial Production Trends | ||||||||
|---|---|---|---|---|---|---|---|---|
| m/m % | Saar % | Yr/Yr | Qtr-2-Date | |||||
| seas adjusted | Nov-08 | Oct-08 | Sep-08 | 3-mo | 6-mo | 12-mo | Yr-Ago | % AR |
| Mining & Manufacturing | -8.1% | -3.1% | 1.1% | -34.5% | -26.0% | -13.3% | 2.0% | -31.3% |
| Total Industry | -7.5% | -3.4% | 1.1% | -33.4% | -25.3% | -12.8% | 1.9% | -31.2% |
| MFG | -8.1% | -3.2% | 1.1% | -34.5% | -26.0% | -13.3% | 2.0% | -31.4% |
| Textiles | -0.9% | -0.2% | -0.9% | -7.7% | -12.7% | -9.8% | -6.9% | -6.3% |
| T-port | -14.2% | -7.4% | 4.8% | -51.9% | -45.0% | -21.9% | 5.4% | -52.4% |
| Product Group | ||||||||
| Consumer Goods | -5.3% | -2.2% | -0.2% | -27.0% | -19.5% | -7.9% | 0.5% | -25.7% |
| Intermediate Goods | -8.1% | -4.7% | 0.7% | -39.3% | -26.8% | -14.7% | 4.2% | -35.7% |
| Investment Goods | -9.7% | -2.6% | 4.6% | -28.7% | -29.2% | -15.7% | -1.8% | -26.8% |
| Mining | 7.6% | -7.5% | -4.4% | -18.1% | 5.2% | -4.0% | 6.5% | -27.0% |
| Electricity & Gas | 0.1% | 1.4% | 2.3% | 16.0% | -3.2% | -1.3% | 2.6% | 1.0% |
by Louise Curley December 30, 2008
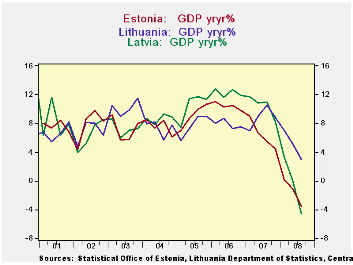 The small
Baltic states, Estonia with a population of 1.34 million, Latvia with
2.26 million and Lithuania with 3.36 million have been hit hard by the
world financial crisis.
The small
Baltic states, Estonia with a population of 1.34 million, Latvia with
2.26 million and Lithuania with 3.36 million have been hit hard by the
world financial crisis.
GDP in Lithuania grew 2.95% in the third quarter from the same period last year. Growth has decelerated rapidly from the 10.54% recorded in the third quarter of 2007. Lithuania, however, has fared better than its two fellow Baltic states. GDP in Estonia in the third quarter of 2008 was actually 3.76% below the corresponding period of 2007. The comparable figure for GDP in Latvia was 4.68%. The year-to-year changes in GDP for the three countries are shown in the first chart.
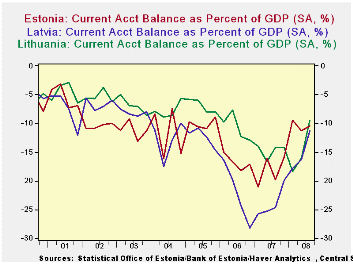
The speed and seriousness with which the world financial crisis had hit the Baltics is due in part to the fragility of their economies as a result of years of running large current account deficits and borrowing abroad.
The second chart shows the current account balances as a percent of GDP for the three countries. The ratios for all three countries have generally been in the negative teens, but Latvia has had current account deficits/GDP as high as -28%.
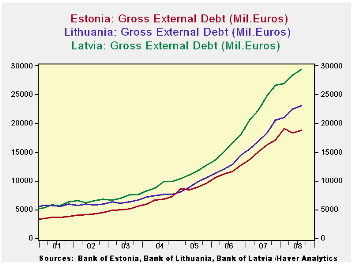
All three countries have borrowed heavily abroad. The gross external debt in euros for each country is shown in the third chart and the ratio of debt to GDP is shown in the table below. Lithuania's debt to GDP ratio rose from 42.5% in 2000 to 72.2% in 2004. In Estonia the ratio rose from .53 in 2000 to 1.12 in 2007, while the ratio in Latvia, rose from .61 to 1.34.
Latvia recently agreed to a $105 billion stabilization package with the IMF and the EU designed to avoid the devaluation of its currency which is tied to the Euro as are the
| BALTIC STATES | Q3 08 | Q2 08 | Q1 08 | Q4 07 | Q3 07 | |||
|---|---|---|---|---|---|---|---|---|
| Y/Y % CHANGE IN GDP | ||||||||
| Latvia | -4.57 | 0.07 | 3.33 | 8.21 | 10.90 | |||
| Lithuania | 2.95 | 4.19 | 7.04 | 8.84 | 10.54 | |||
| Estonia | -3.54 | -1.11 | 0.19 | 4.81 | 5.53 | |||
| CURRENT ACCOUNT BALANCE/GDP | ||||||||
| Latvia | -11.25 | -16.31 | -17.89 | -19.95 | -24.63 | |||
| Lithuania | -9.96 | -16.05 | -18.34 | -14.26 | -14.23 | |||
| Estonia | -10.45 | -16.30 | -9.53 | -15.74 | -19.81 | |||
| GROSS EXTERNAL DEBT/GDP | 2007 | 2006 | 2005 | 2004 | 2003 | 2002 | 2001 | 2000 |
| Latvia | 1.34 | 1.14 | .99 | .93 | .50 | .72 | .68 | .61 |
| Lithuania | .72 | .61 | .51 | .42 | .40 | .39 | .43 | .42 |
| Estonia | 1.12 | .98 | .86 | .76 | .64 | .58 | .53 | .53 |

Tom Moeller
AuthorMore in Author Profile »Prior to joining Haver Analytics in 2000, Mr. Moeller worked as the Economist at Chancellor Capital Management from 1985 to 1999. There, he developed comprehensive economic forecasts and interpreted economic data for equity and fixed income portfolio managers. Also at Chancellor, Mr. Moeller worked as an equity analyst and was responsible for researching and rating companies in the economically sensitive automobile and housing industries for investment in Chancellor’s equity portfolio. Prior to joining Chancellor, Mr. Moeller was an Economist at Citibank from 1979 to 1984. He also analyzed pricing behavior in the metals industry for the Council on Wage and Price Stability in Washington, D.C. In 1999, Mr. Moeller received the award for most accurate forecast from the Forecasters' Club of New York. From 1990 to 1992 he was President of the New York Association for Business Economists. Mr. Moeller earned an M.B.A. in Finance from Fordham University, where he graduated in 1987. He holds a Bachelor of Arts in Economics from George Washington University.
More Economy in Brief


