 Global| Nov 03 2009
U.S. Construction SpendingIncreases Moderately But Residential Recovery Firms
by:Tom Moeller
|in:Economy in Brief
Summary
Divergent trends within the construction sector haven't yet added up to any meaningful improvement in the total but it could be on the way. Reported yesterday, September construction spending rose 0.8% following steady monthly [...]
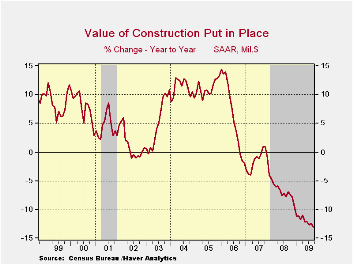
Divergent trends within the construction sector haven't yet added up to any meaningful improvement in the total but it could be on the way. Reported yesterday, September construction spending rose 0.8% following steady monthly declines during the last two years. Consensus estimates had been for yet another decline. Nevertheless, improvement in activity in the residential sector has picked up to a degree which may foreshadow improvement elsewhere.
Residential building activity increased firmly for the second
consecutive month. The 3.9% m/m rise followed a similar gain in August
and lifted the level of building activity to its highest since
February. Single-family construction rose 2.4% (-35.0% y/y) for the
fourth consecutive strong monthly increase. Spending on improvements
also firmed by 7.2% (-12.5% y/y) in September after a 5.7% August
increase. Offsetting the strength here has been a steady decline in
multifamily building (-41.2% y/y). 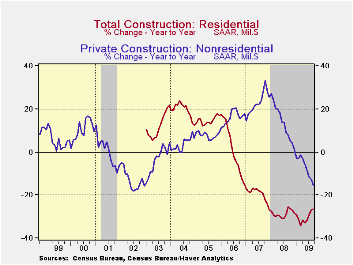
Poor corporate profitability and reduced economic activity generally continued to negatively affect nonresidential building activity. It fell 1.8% during September following similar declines during the prior three months. Over the four months combined, nonresidential outlays overall dropped 10.2%. Spending by the food & beverage industries declined 26.2% during those four months as it did in the automotive sector. Hotel & motel spending fell 19.0%; commercial & amusements also fell 19.3% and office building dropped 11.6%. Relatively firm was the four-month spending decline in the education sector which totaled 6.2%. Spending on health care structures was down 3.5% but building activity in the religious sector actually rose 1.3% during the four months.
Public construction overall has been firm, up 6.1% y/y.
Spending recouped the August decline with a 1.3% increase. Building
activity by state & local governments on power facilities rose
8.6% (32.0% y/y). The transportation area increased 2.7% (23.1% y/y).
Public spending on health care facilities 3.4% (4.0% y/y and spending
on highways & streets rose 1.0% (2.8% y/y).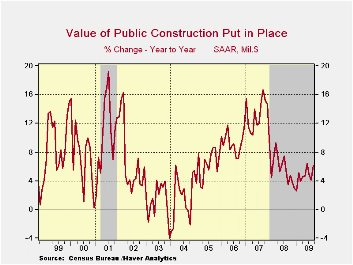
The construction put-in-place figures are available in Haver's USECON database.
Incentive Compensation, Risk Management, and Safety and Soundness is yesterday's speech by Federal Reserve Board Governor Daniel K. Tarullo an it can be found here here.
| Construction (%) | September | August | July | Y/Y | 2008 | 2007 | 2006 |
|---|---|---|---|---|---|---|---|
| Total | 0.8 | -0.1 | -1.2 | -13.0 | -6.9 | -1.6 | 6.3 |
| Private | 0.5 | 0.4 | -1.8 | -20.6 | -11.1 | -5.7 | 5.5 |
| Residential | 3.9 | 3.8 | 0.1 | -27.0 | -29.1 | -19.7 | 1.0 |
| Nonresidential | -1.8 | -1.8 | -3.0 | -15.4 | 13.2 | 23.1 | 16.2 |
| Public | 1.3 | -1.1 | 0.1 | 6.1 | 5.6 | 13.1 | 9.3 |
Selected Car Registrations In Europe
by Robert Brusca November 03, 2009
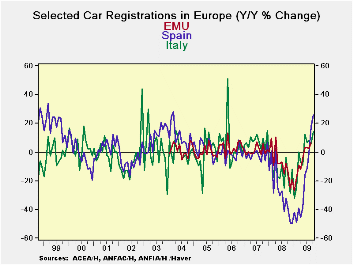
The auto sector is giving Europe a boost as incentive programs are still helping to stimulate sales. Only Italy and Spain have reported registrations for October but despite poor growth in both regions auto sales are growing in strongly. Spain’s sales are up by 1.7% m/m in October and up at a 99% annual rate over three months even as unemployment has hit a 10Year high there. Italy backed off in October after a strong September.
Troubles in the financial sector have banks as less than wiling lenders. Tough economic times have put consumers on the sidelines. But government programs to stimulate demand with outright subsidies linked to the scrappage of old poor-mileage vehicles has been a way to stimulate demand and to vest theses programs with some sense of a public purpose.
EMU Italy and Spain all saw sales crater at about the same time. Despite different auto incentive programs in different countries we see that Spain and Italy, two of the more challenged EMU economies, with auto sectors that are very much in sync with the rest of Europe. Evidence is that the recession in EMU is ending.
The EU Commission today issued a new outlook for the Zone and confirmed that it sees recovery taking hold. It sees a contraction of 4.1% for the EU area this year followed by growth of 0.7% in 2010 and of 1.6% in 2011 and roughly similar growth metrics for the Zone. This outlook is a hike in its forecast from its previous stance than growth in 2010 would contract by 0.1% in EMU.
| E zone Car Registrations | |||||||||
|---|---|---|---|---|---|---|---|---|---|
| Mo/Mo % | 3Mo Trend From | 6Mo Trend From | 12Mo Trend From | ||||||
| All Seas Adj | Oct 09 | Sep 09 | Aug 09 | Oct 09 | Sep 09 | Oct 09 | Sep 09 | Oct 09 | Sep 09 |
| Italy | -1.6% | 19.3% | -13.6% | 5.8% | 13.4% | 16.1% | 44.9% | 14.5% | 6.2% |
| Spain | 1.7% | 28.8% | -9.3% | 99.0% | 158.6% | 117.0% | 181.5% | 25.8% | 17.7% |
| base Month of Calc | Sep-09 | Aug-09 | Jul-09 | Jul-09 | Jun-09 | Apr-09 | Mar-09 | Oct-08 | Sep-08 |
U.S. Factory Inventory Decumulation Rate Still Strong
by Tom Moeller November 03, 2009
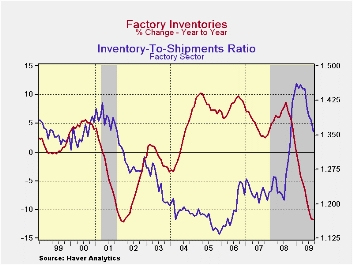
Factory inventories continued lower during September as the stage continued to be set for a firm rebound in manufacturing activity. Of course that rebound is dependant on whether demand improves, and there are tentative indications that it is. Factory inventories fell 1.0% during September, about as they did during the prior four months. Despite the strength of these declines, the 4.6% decline during the period is a clear moderation from the 6.5% rate during the five months through April.
The moderation in inventory decumulation rates continues
spotty amongst various industries. Inventories of electrical equipment
& appliances have fallen at a reduced 6.6% rate during the
period but decumulation of machinery inventories continued firm at a
7.3% rate. Furniture inventories fell at a reduced 8.8% rate. The rate
of decumulation of primary metals inventories also slowed as did cuts
of motor vehicle & parts inventories. Inventory reductions of
computers & electronic products continued firm but it may have
bottomed.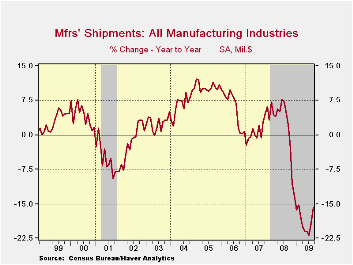
Factory shipments have started to rise moderately. On a three-month basis they're up at a 3.5% rate after the 40% plus rates of decline last Winter. Shipments of primary metals have firmed to a 52.5% growth rate over the last three months and computers & electronics shipments rose at a 4.7% rate. Shipments of transportation equipment rose at a 25.1% rate led by a surge in shipments of nondefense aircraft & parts. Shipments of basic chemicals also turned up as did shipments from textile mills. The shipments improvement has caused unfilled orders to fall at a much-reduced 3.9% rate through September.
Overall, the reduction of inventories in the factory sector has succeeded in lowering the inventory-to-sales ratio. The decline to 1.36 was to its lowest level since October of last year and down from the recent peak of 1.46.
Finally, new orders have improved. The 0.9% increase during September raised orders at a 6.0% rate during the last three months. It reflected improvement in orders for transportation equipment, machinery, primary metals and electrical equipment.
The Manufacturers' Shipments, Inventories and Orders (MSIO) data is available in Haver's USECON database.
| Factory Survey (NAICS, %) | September | August | Y/Y | 2008 | 2007 | 2006 |
|---|---|---|---|---|---|---|
| Inventories | -1.0 | -0.9 | -11.8 | 2.1 | 3.7 | 8.2 |
| Excluding Transportation | -0.7 | -0.4 | -14.1 | -0.6 | 2.7 | 7.9 |
| New Orders | 0.9 | -0.8 | -17.1 | 0.1 | 1.9 | 6.2 |
| Excluding Transportation | 0.8 | 0.3 | -15.7 | 3.1 | 1.2 | 7.4 |
| Shipments | 0.8 | -0.2 | -15.9 | 1.7 | 1.2 | 5.9 |
| Excluding Transportation | 0.1 | -0.1 | -16.5 | 3.7 | 1.5 | 6.7 |
| Unfilled Orders | -0.4 | -0.4 | -11.5 | 3.5 | 17.1 | 15.3 |
| Excluding Transportation | 0.5 | -0.1 | -14.2 | -1.0 | 8.2 | 16.0 |
Brazil's Industrial Production Points To Good Third Quarter Growth In GDP
by Louise Curley November 3, 2009
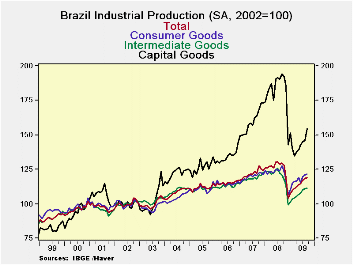
Brazilian industrial production increased 0.75% to 119.2
(2002=100) in September from 118.3 in August, a little short of
expectations, but still on the upward trend that began in January. The
three major marketing groups--capital goods, intermediate goods and
consumer goods--have all recovered from their falls in December as can
be seen in the first chart. The decline in capital goods was especially
severe and the recovery equally sharp.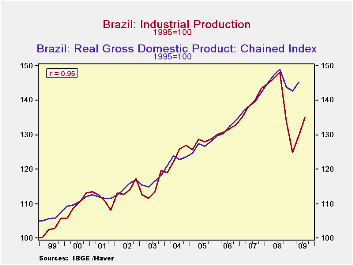
Industrial production is a good proxy for Brazilian GDP. Brazil reports real GDP on an index basis with 1995=100. We rebased the Industrial production index to 1995=100 and aggregated the monthly figures to quarterly. The second chart compares this index with the index of real GDP. The correlation between the two series is strong at .97. In the third quarter, industrial production increased 4.1%. A 3.9% increase in industrial production was associated with a 1.9% increase in real GDP. If the relationship between industrial production and real GDP holds, Brazil's real GDP should show another roughly 2% rise in GDP in the third quarter.
| BRAZIL | Sep 09 | Aug 09 | Sep 08 | M/M % | Y/Y % | 2008 | 2007 | 2006 |
|---|---|---|---|---|---|---|---|---|
| Industrial Production (2002=100) as reported | 109.2 | 118.3 | 129.7 | 0.75 | -8.1 | 125.3 | 121.8 | 115.0 |
| Industrial Production (1995=100) | 136.2 | 135.2 | 148.3 | 0.75 | -8.1 | 143.2 | 139.2 | 131.5 |
| Q3 09 | Q2 09 | Q1 09 | Q4 08 | Q3 08 | Q2 08 | Q1 08 | ||
| Real GDP (1995=100) | 145.3 | 142.7 | 146.0 | 149.0 | 147.1 | 144.9 | ||
| Industrial Production (1995=100) | 135.1 | 129.8 | 124.9 | 133.8 | 148.2 | 146.3 | 144.7 |

Tom Moeller
AuthorMore in Author Profile »Prior to joining Haver Analytics in 2000, Mr. Moeller worked as the Economist at Chancellor Capital Management from 1985 to 1999. There, he developed comprehensive economic forecasts and interpreted economic data for equity and fixed income portfolio managers. Also at Chancellor, Mr. Moeller worked as an equity analyst and was responsible for researching and rating companies in the economically sensitive automobile and housing industries for investment in Chancellor’s equity portfolio. Prior to joining Chancellor, Mr. Moeller was an Economist at Citibank from 1979 to 1984. He also analyzed pricing behavior in the metals industry for the Council on Wage and Price Stability in Washington, D.C. In 1999, Mr. Moeller received the award for most accurate forecast from the Forecasters' Club of New York. From 1990 to 1992 he was President of the New York Association for Business Economists. Mr. Moeller earned an M.B.A. in Finance from Fordham University, where he graduated in 1987. He holds a Bachelor of Arts in Economics from George Washington University.
More Economy in Brief


