 Global| Dec 01 2008
U.S. Construction Spending Off Sharply Again
by:Tom Moeller
|in:Economy in Brief
Summary
The October value of construction put in place fell 1.2% during October. The decline followed a slight September downtick which was revised to be shallower than the initial report. Consensus expectations had been for a 0.9%. [...]
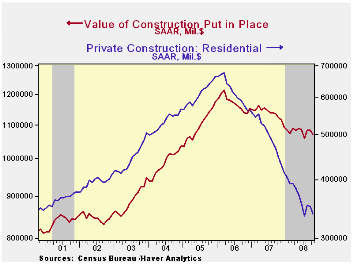
The October value of construction put in place fell 1.2% during October. The decline followed a slight September downtick which was revised to be shallower than the initial report. Consensus expectations had been for a 0.9%. Construction activity continued to decline 4.6% y/y.
Residential building activity again led the latest monthly decline with a 3.5% drop and activity remained off by a quarter from last year. Single-family construction activity fell 4.6%, off by two-thirds from its peak in early-2006. Building activity on multi-family units slipped 0.3% (-1.4 y/y), off roughly 20% from the early 2007 peak. Spending on improvements fell 3.2% m/m but still was up slightly versus last year.
During the last twenty years there has been an 84% correlation between the q/q change in the value of residential building and its contribution to growth in real GDP.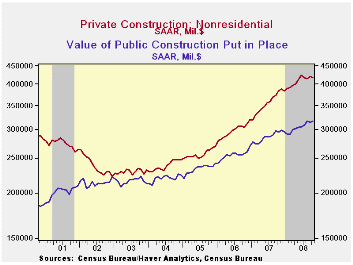
The value of nonresidential building activity slipped 0.7% after a little-revised 1.1% September increase. Spending on office construction did rise 1.1% but the y/y gain of 4.4% is much reduced from the near 20% growth of the prior two years. Building in the multi-retail sector rose 7.5% but the y/y decline of 7.2% compares to a 17% gain last year. Spending on health care facilities reversed a September increase and fell 1.1% (+3.9% y/y).
Public construction reversed a September decline and rose 0.7%. The value of spending on educational facilities rose a firm 1.2% (10.1% y/y) but the value of construction spending on highways & streets fell for the second month by 0.9% (+6.3% y/y). The value of construction on highways & streets is roughly one-third of the value of total public construction spending.
The more detailed categories of construction represent the Census Bureau’s reclassification of construction activity into end-use groups. Finer detail is available for many of the categories; for instance, commercial construction is shown for automotive sales and parking facilities, drugstores, building supply stores, and both commercial warehouses and mini-storage facilities. Note that start dates vary for some seasonally adjusted line items in 2000 and 2002, and that constant-dollar data are no longer computed.
| Construction (%) | October | September | Y/Y | 2007 | 2006 | 2005 |
|---|---|---|---|---|---|---|
| Total | -1.2 | -0.0 | -4.6 | -2.7 | 6.3 | 11.2 |
| Private | -2.0 | 0.4 | -8.8 | -6.9 | 5.5 | 12.7 |
| Residential | -3.5 | -0.5 | -24.2 | -19.8 | 1.0 | 14.9 |
| Nonresidential | -0.7 | 1.1 | 9.1 | 19.6 | 16.2 | 7.8 |
| Public | 0.7 | -0.9 | 7.4 | 12.3 | 9.3 | 6.2 |

Tom Moeller
AuthorMore in Author Profile »Prior to joining Haver Analytics in 2000, Mr. Moeller worked as the Economist at Chancellor Capital Management from 1985 to 1999. There, he developed comprehensive economic forecasts and interpreted economic data for equity and fixed income portfolio managers. Also at Chancellor, Mr. Moeller worked as an equity analyst and was responsible for researching and rating companies in the economically sensitive automobile and housing industries for investment in Chancellor’s equity portfolio. Prior to joining Chancellor, Mr. Moeller was an Economist at Citibank from 1979 to 1984. He also analyzed pricing behavior in the metals industry for the Council on Wage and Price Stability in Washington, D.C. In 1999, Mr. Moeller received the award for most accurate forecast from the Forecasters' Club of New York. From 1990 to 1992 he was President of the New York Association for Business Economists. Mr. Moeller earned an M.B.A. in Finance from Fordham University, where he graduated in 1987. He holds a Bachelor of Arts in Economics from George Washington University.
More Economy in Brief


