 Global| Nov 01 2020
U.S. Construction Spending Growth Slowed in September; Revisions Mixed in July and August
Summary
• Construction spending increased just 0.3% in September, with August revised down and July revised somewhat higher. • Residential showing consistently sizable increases; nonresidential down three months in a row. • Both state & local [...]
• Construction spending increased just 0.3% in September, with August revised down and July revised somewhat higher.
• Residential showing consistently sizable increases; nonresidential down three months in a row.
• Both state & local gov’t and federal gov’t construction decrease.
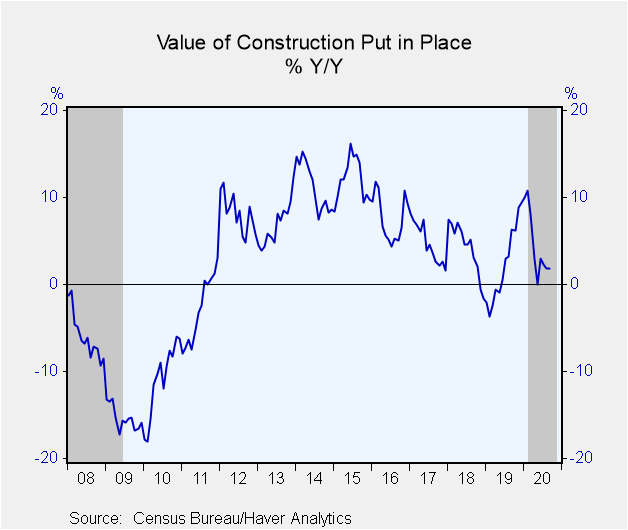
The value of construction put in place rose just 0.3% in September (1.9% year/year), less than the 0.9% projected in the Action Economics forecast survey. The amount of construction activity in August was revised down to an 0.8% gain from 1.1% reported a month ago, while the July total was revised upward to 1.1% from 0.7%.
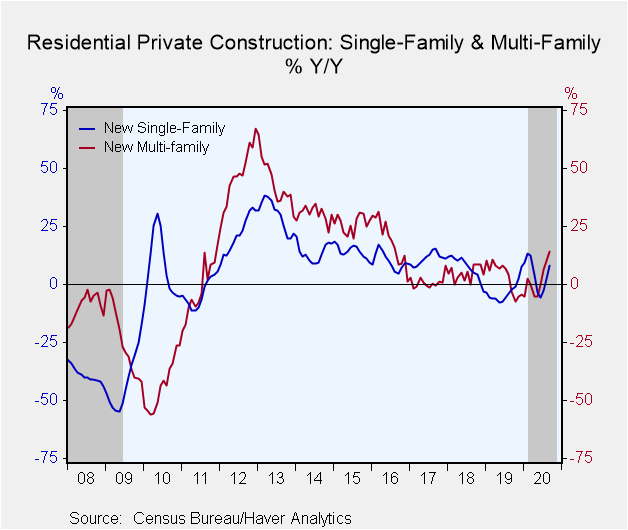
The slowdown in total construction growth occurred in all major sectors. Private residential construction remained the strongest in month-to-month expansion with a 2.8% increase in September, although less than the 3.3% in August. The September gain raised the year/year advance to 9.9%. Single-family home construction increased 5.7% (+8.2% y/y) in the month, while home improvements actually had an outright decline of 0.4%, although that still left the year/year move at +11.1%.
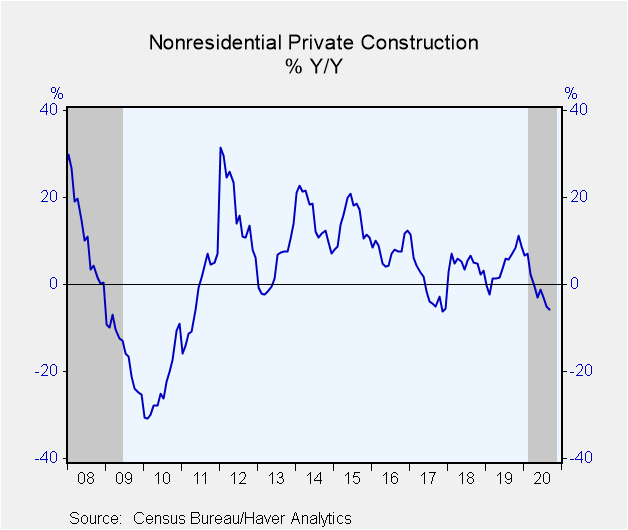
Private nonresidential construction fell 1.5% in September, the third monthly decline in a row and the largest one. A 5.8% decline year-on-year was the result. Among building use types, only offices (+0.3%) and religious (+2.8%) had increases in the month. The largest decreases were in amusements (-2.7%), power generation (-2.2%) and manufacturing (-2.1%).
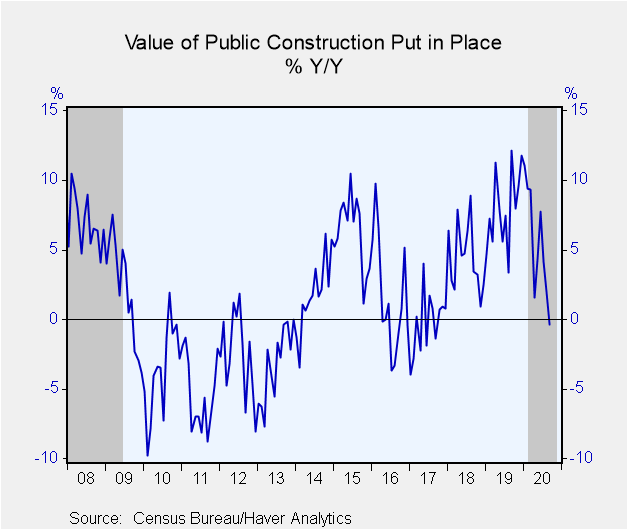
In the public sector, state and local government construction fell 1.2% in September (0.1% year/year), the fifth monthly decline in the last six months. The two largest segments of that sector, highway and street construction dropped 5.4% (-2.5% year/year) while education actually rose 2.1% (-0.9% year/year). Federal government building decreased 6.7% in the month, a third consecutive decrease and down 6.1% year/year.
The construction spending figures, some of which date back to 1946 can be found in Haver's USECON database. The Action Economics expectations reading is in the AS1REPNA database.
| Construction Put in Place (SA, %) | Sep | Aug | Jul | Sep Y/Y | 2019 | 2018 | 2017 |
|---|---|---|---|---|---|---|---|
| Total | 0.3 | 0.8 | 1.1 | 1.5 | 2.4 | 4.2 | 4.6 |
| Private | 0.9 | 1.5 | 2.1 | 2.4 | 0.8 | 4.0 | 6.1 |
| Residential | 2.8 | 3.3 | 3.9 | 9.9 | -2.4 | 3.4 | 12.4 |
| Nonresidential | -1.5 | -0.6 | -0.1 | -6.0 | 4.5 | 4.8 | -0.7 |
| Public | -1.7 | -1.3 | -1.7 | -1.3 | 7.8 | 4.6 | -0.1 |
Carol Stone, CBE
AuthorMore in Author Profile »Carol Stone, CBE came to Haver Analytics in 2003 following more than 35 years as a financial market economist at major Wall Street financial institutions, most especially Merrill Lynch and Nomura Securities. She had broad experience in analysis and forecasting of flow-of-funds accounts, the federal budget and Federal Reserve operations. At Nomura Securities, among other duties, she developed various indicator forecasting tools and edited a daily global publication produced in London and New York for readers in Tokyo. At Haver Analytics, Carol was a member of the Research Department, aiding database managers with research and documentation efforts, as well as posting commentary on select economic reports. In addition, she conducted Ways-of-the-World, a blog on economic issues for an Episcopal-Church-affiliated website, The Geranium Farm. During her career, Carol served as an officer of the Money Marketeers and the Downtown Economists Club. She had a PhD from NYU's Stern School of Business. She lived in Brooklyn, New York, and had a weekend home on Long Island.
More Economy in Brief
 Global| Feb 05 2026
Charts of the Week: Balanced Policy, Resilient Data and AI Narratives
by:Andrew Cates


