 Global| Feb 04 2008
U.S. Construction Spending Decline Largest Since 1991
by:Tom Moeller
|in:Economy in Brief
Summary
During December, the value of construction put in place fell 1.1% after a downwardly revised 0.4% November dip. The latest decline was the third consecutive monthly drop and it finished a year where activity fell 2.7%, the largest y/y [...]
During December, the value of construction put in place fell 1.1% after a downwardly revised 0.4% November dip. The latest decline was the third consecutive monthly drop and it finished a year where activity fell 2.7%, the largest y/y drop since 1991.
Deep recession in the housing industry weighed on residential building and dropped construction activity by 2.8% m/m after a huge 3.0% plunge during November. The annual decline of 18.3% in residential building was a record. Construction activity on new single family units was off 5.4% in December and by 27.3% for the entire year. Building activity on multi-family units also fell by a sharp 1.9% and by 6.5% for the year. Spending on improvements registered the only m/m increase in December with a 1.0% rise that limited the drop in activity to 0.3% for the year.
Housing and the "R" Word from the Federal Reserve Bank of St. Louis can be found here .
During the last twenty years there has been an 84% correlation
between the q/q change in the value of residential building and its
contribution to growth in real GDP.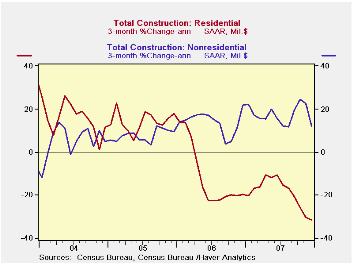
Firm gains in nonresidential building activity continued in December to cushion the downside in overall building spending. Nonresidential building activity rose 1.3% in December for the fifth straight strong monthly gain. It raised spending by 18.2% for the year after a another double digit rise in 2006. Building in the lodging area rose a huge 62.9% during all of last year while office construction surged 20.1%. Multi-unit retail (shopping malls) rose 15.3% after gains of 28.0% and of 20.9% during the two prior years and commercial building activity surged 13.5%.
The bright spots last year in the nonresidential area also were a 20.4% gain in education and an 11.6% rise in the health care industry. Spending in the factory sector also rose by 9.2% last year after a 14.4% 2006 gain & a 26.6% 2005 surge. Spending in the transportation area increased 8.3% on the heels of a 12.2% rise during 2006.
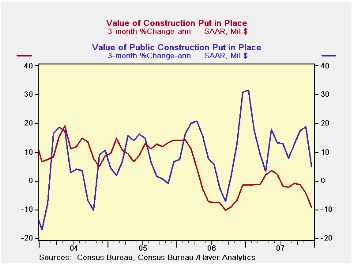
Public construction spending also was strong last year and rose 12.5%. Construction on highways & streets rose 7.6% after increases of 11.9% and 8.8% during the two prior years. The value of construction on highways & streets is nearly one third of the value of total public construction spending. Construction spending in education area also surged by 12.8% last year after strong gains during the two prior years while spending on health care facilities jumped 28.5%.
These more detailed categories represent the Census Bureau’s
reclassification of construction activity into end-use groups. Finer
detail is available for many of the categories; for instance,
commercial construction is shown for Automotive sales and parking
facilities, drugstores, building supply stores, and both commercial
warehouses and mini-storage facilities. Note that start dates vary for
some seasonally adjusted line items in 2000 and 2002 and that
constant-dollar data are no longer computed.
| December | November | Y/Y | 2007 | 2006 | 2005 | |
|---|---|---|---|---|---|---|
| Total | -1.1% | -0.4% | -2.3% | -2.7% | 5.6% | 10.7% |
| Private | -1.0% | -1.0% | -6.1% | -6.8% | 4.7% | 12.0% |
| Residential | -2.8% | -3.0% | -20.4% | -18.3% | 0.5% | 13.7% |
| Nonresidential | 1.3% | 1.8% | 20.4% | 18.2% | 15.2% | 7.8% |
| Public | -1.5% | 1.3% | 10.1% | 12.5% | 9.2% | 6.2% |
by Tom Moeller February 4, 2008
U.S. sales of light vehicles in January fell 6.3% m/m to a
15.24M unit annual selling rate, according to the Autodata Corporation.
That rate of sales was the lowest since October of 2005. After two
years when sales fell 2.2% in 2007 and 2.5% in 2006, sales started 2008
5.8% below the 2007 average.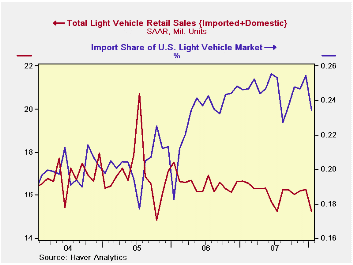
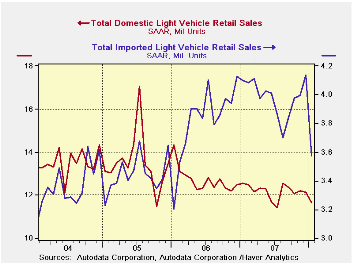
Sales of domestically made light vehicles fell 3.8% last month after a 0.6% dip in December. Sales of U.S. made cars dropped 3.8% after the 4.8% December decline. Sales of domestically made cars also dropped 3.8% after a 4.8% m/m December decline while sales of domestically made light trucks also fell 3.8%. That gave back all of a 2.9% December gain.
Sales of imported light vehicles plunged 13.6% to 3.57M units, the lowest since early 2006. Sales of imported autos were off 15.4% m/m while sales of imported light trucks dropped 10.6%.
Import's share of the U.S. light vehicle market fell back to 23.5% from a record 24.6% for of last year.
Economy in Slower Traffic Through 2008 from the Federal Reserve Bank of Chicago is available here.
| Light Vehicle Sales (SAAR, Mil. Units) | January | December | Y/Y | 2007 | 2006 | 2005 |
|---|---|---|---|---|---|---|
| Total | 15.24 | 16.27 | -8.5% | 16.18 | 16.55 | 16.96 |
| Autos | 7.22 | 7.82 | -5.7% | 7.58 | 7.77 | 7.65 |
| Domestic | 5.01 | 5.21 | -2.2% | 5.07 | 5.31 | 5.40 |
| Imported | 2.21 | 2.62 | -12.9% | 2.51 | 2.45 | 2.25 |
| Light Trucks | 8.02 | 8.44 | -10.8% | 8.60 | 8.78 | 9.32 |
| Domestic | 6.66 | 6.92 | -10.4% | 7.12 | 7.42 | 8.12 |
| Imported | 1.36 | 1.52 | -12.5% | 1.48 | 1.37 | 1.20 |
by Robert Brusca February 4, 2008
 PPI Trends.
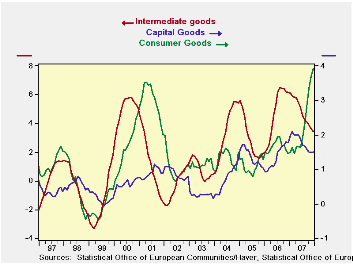
PPI trends are accelerating for the headline measure as well
as for key country level headlines for inflation.
In the Euro area inflation continues to flare for energy and
for MFG goods more generally. Capital goods inflation has remained
subdued at a low of 1.5% Yr/Yr pace. Consumer goods inflation has
backed off its highs but is still strong at 3.9% Yr/Yr. Intermediate
goods inflation has worked its way lower as well. Inflation ex-energy
has come back down to 2.1%, just a small step over the 2% rate that the
ECB has set as its overall inflation ceiling for the Euro area-wide
HICP. In that respect inflation is beginning to behave. Once energy
prices stop boosting headline inflation there is every reason to
believe that the overall rate will revert to the core.
By country…
For Germany, Italy and France, while headline inflation is
clearly over the top, ex-energy inflation shows hopeful trends, for
Germany and Italy, ex-energy inflation is at a 1.4% pace over three
months and is below the 2% over the three- and six-month horizons. In
France, the ex-energy inflation rate is at 2.2% above the 2% headline
ceiling pace but in a mode of deceleration.
The UK shows that over the top inflation is still
accelerating. At 3.6% ex-energy inflation is over the top as well and
roughly stable at that pace making the BOE’s task difficult.
Summing up
On balance there is reason for some optimism since the ex-energy measures are in better shape than the headline inflation rates, except for the UK. Ex-energy rates are decelerating as well and in the case of Germany and Italy they already are well below the 2% top-allowable pace for inflation generally. This progress may be enough to keep the ECB on hold and waiting for these core trends to take root. In time it should dominate the now higher headline rates of inflation across the Euro area nations as oil prices settle lower in the wake of the global slowing in growth.
| Euro Area and UK PPI Trends | ||||||
|---|---|---|---|---|---|---|
| M/M | Saar | |||||
| Ezone-13 | Dec-07 | Nov-07 | 3-Mo | 6-Mo | Yr/Yr | Y/Y Yr Ago |
| Total excl Constructions | 0.1% | 0.9% | 6.8% | 4.9% | 4.3% | 4.1% |
| Excl Energy | 0.1% | 0.1% | 2.1% | 2.5% | 3.1% | 3.4% |
| Capital Goods | 0.1% | 0.0% | 0.9% | 1.0% | 1.5% | 1.8% |
| Consumer Goods | 0.3% | 0.3% | 4.8% | 5.3% | 3.9% | 1.5% |
| Intermediate & Capital Goods | -0.1% | 0.0% | 0.7% | 1.0% | 2.7% | 4.4% |
| Energy | 0.1% | 3.4% | 23.2% | 13.0% | 8.3% | 6.2% |
| Manufacturing | 0.0% | 0.8% | 5.3% | 4.3% | 4.7% | 2.9% |
| Germany | -0.1% | 0.8% | 4.8% | 2.7% | 2.5% | 4.4% |
| Germany excl Energy | 0.0% | -0.1% | 1.4% | 1.4% | 2.2% | 2.9% |
| France | 0.2% | 0.8% | 6.8% | 5.6% | 4.5% | 2.7% |
| France excl Energy | 0.2% | 0.1% | 2.2% | 3.1% | 3.0% | 2.8% |
| Italy | -0.1% | 1.1% | 6.4% | 5.4% | 4.6% | 5.2% |
| Italy excl Energy | -0.1% | 0.2% | 1.4% | 1.9% | 3.0% | 4.2% |
| UK | 0.5% | 2.9% | 23.8% | 15.2% | 4.0% | 0.4% |
| UK excl Energy | 0.3% | 0.2% | 3.6% | 3.4% | 3.5% | 3.1% |
| E-zone 13 Harmonized PPI excluding Construction | ||||||
| The EA 13 countries are Austria, Belgium, Finland, France, Germany, | ||||||
| Greece, Ireland, Italy, Luxembourg, the Netherlands, Portugal, Slovenia | ||||||
by Louise Curley February 4, 2008
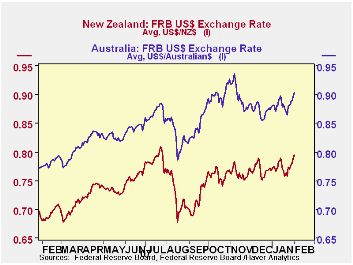
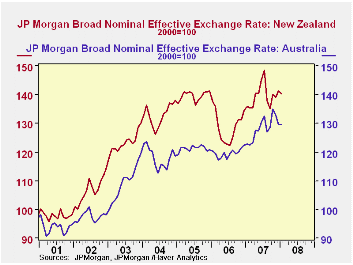
Both the Australian and New Zealand dollars have rebounded, if somewhat irregularly, since the U. S. Federal Reserve Board started to lower interest rates in September, as can be seen in the first chart, showing the daily values of the two currencies for the past year or so. A longer term perspective is shown in the second chart where the broad J. P. Morgan effective nominal trade weighted indexes are shown. This chart shows not only that the appreciations of these currencies have been underway since the beginning of this decade, but it also shows that the appreciations have been widespread and not simply with the U. S. dollar.
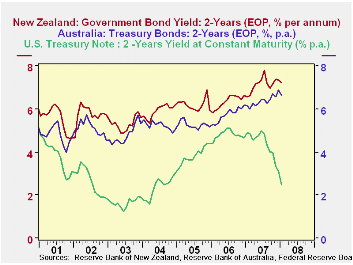
While interest rate differentials are not the only factor in the relative value of one country vis-à-vis another, they are among the more important. The third chart shows the yield on a 2-year government security in the three countries. Interest rates in Australia and New Zealand have been substantially above those in the U. S and steady while those in the U. S. have dropped sharply since the Fed began to cut rates. As of January of this year the differential between the 2-year security in Australia and the U. S. was 4.25 points and in New Zealand and the U. S. security, 4.73 points.
| AUSTRALIA AND NEW ZEALAND | Jan 31, 2008 | Sep 7, 2007 | Jul 24, 2007 | Jan 31, 2007 |
|---|---|---|---|---|
| Australian $ (U. S.$) | .8968 | .8259 | .8841 | .7740 |
| New Zealand $ (U. S.$) | .7884 | .6889 | .8069 | .6856 |
| Jan 2008 | Sep 2007 | Jan 2007 | -- | |
| Australian Trade Weighted 2000=100 | 129.6 | 128.7 | 122.7 | -- |
| New Zealand Trade Weighted (2000=100) | 140.4 | 135.1 | 135.9 | -- |
| 2-Year Government Security (EOP) % | ||||
| Australia | 6.63 | 6.43 | 6.15 | -- |
| New Zealand | 7.21 | 6.97 | 9.57 | -- |
| U. S. | 2.48 | 3.97 | 4.88 | -- |

Tom Moeller
AuthorMore in Author Profile »Prior to joining Haver Analytics in 2000, Mr. Moeller worked as the Economist at Chancellor Capital Management from 1985 to 1999. There, he developed comprehensive economic forecasts and interpreted economic data for equity and fixed income portfolio managers. Also at Chancellor, Mr. Moeller worked as an equity analyst and was responsible for researching and rating companies in the economically sensitive automobile and housing industries for investment in Chancellor’s equity portfolio. Prior to joining Chancellor, Mr. Moeller was an Economist at Citibank from 1979 to 1984. He also analyzed pricing behavior in the metals industry for the Council on Wage and Price Stability in Washington, D.C. In 1999, Mr. Moeller received the award for most accurate forecast from the Forecasters' Club of New York. From 1990 to 1992 he was President of the New York Association for Business Economists. Mr. Moeller earned an M.B.A. in Finance from Fordham University, where he graduated in 1987. He holds a Bachelor of Arts in Economics from George Washington University.
More Economy in Brief


