 Global| Apr 08 2008
U.S. Chain Store Sales RiseModerate, Gas Prices Rise Strong
by:Tom Moeller
|in:Economy in Brief
Summary
According to the International Council of Shopping Centers ICSC-UBS Chain Store survey, sales rose 0.7% last week and recovered the declines of the prior two weeks. The increase left the opening level of sales this month 0.5% higher [...]
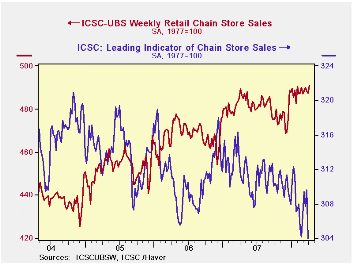
According to the International Council of Shopping Centers ICSC-UBS Chain Store survey, sales rose 0.7% last week and recovered the declines of the prior two weeks. The increase left the opening level of sales this month 0.5% higher than the March average which was unchanged from February.
>During the last ten years there has been a 45%
correlation
between the y/y change in chain store sales and the change in nonauto
retail sales less gasoline.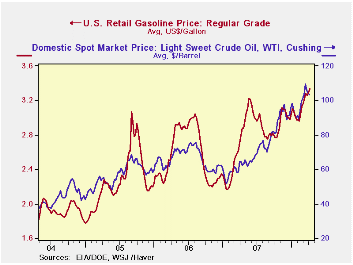
The ICSC-UBS retail chain-store sales index is constructed using the same-store sales (stores open for one year) reported by 78 stores of seven retailers: Dayton Hudson, Federated, Kmart, May, J.C. Penney, Sears and Wal-Mart.
During the latest week the leading indicator of chain store sales from ICSC-UBS plunged 1.8% last week to the lowest level since early 2002.
Higher prices for gasoline prices are just one factor dampening any rise in store sales. The four cent rise last week lifted the retail price for a gallon of regular to $3.32, up 28 cents or 9.1% this year.
Global Economic and Financial Challenges: Implications for Latin America is yesterday's speech by Fed Governor Randall S. Kroszner and it can be found here.
| ICSC-UBS (SA, 1977=100) | 04/04/08 | 03/28/08 | Y/Y | 2007 | 2006 | 2005 |
|---|---|---|---|---|---|---|
| Total Weekly Chain Store Sales | 490.8 | 487.5 | 0.3% | 2.8% | 3.3% | 3.6% |
| 04/07/08 | 3/31/08 | |||||
| Retail Gasoline ($ per gallon) | 3.32 | 3.29 | 18.9% | 2.80 | 2.57 | 2.27 |
by Tom Moeller April 8, 2008
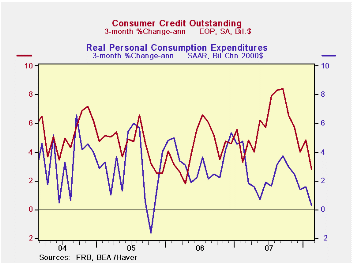
Consumer credit outstanding rose $5.1B during February, roughly half the gain posted for January.
The weak rise lowered three month growth in credit to 2.8% (AR) which, due to slower growth in consumer spending, was half the rate of gain during all of last year.
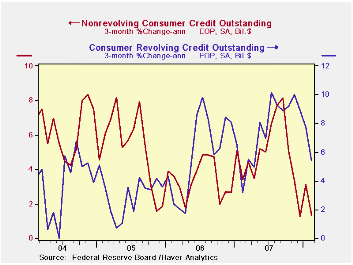
Growth in revolving credit slowed only somewhat m/m to $4.7B but three month growth halved from its November high to 5.4% (AR).
The gain in non-revolving credit, which accounts for nearly two thirds of total consumer credit, grew just $0.5B and the three month growth rate dropped to 1.3% (AR) versus a high of 8.1% last September.
These figures are the major input to the Fed's Flow of Funds accounts for the household sector, released quarterly.
The Recession Dating Procedure from the National Bureau of Economic Research (NBER) can be found here.
| Consumer Credit (m/m Chg, SAAR) | February | January | Y/Y | 2007 | 2006 | 2005 |
|---|---|---|---|---|---|---|
| Total | $5.1B | $10.3B | 5.8% | 5.7% | 4.5% | 4.3% |
| Revolving | $4.7B | $5.6B | 8.2% | 7.5% | 6.1% | 3.1% |
| Non-revolving | $0.5B | $4.8B | 4.4% | 4.7% | 3.6% | 4.9% |
by Louise Curley April 8, 2008
Economy watchers in Japan are people who hold jobs that enable them to gauge present conditions and future prospects in their respective lines of business. Since 2001, there have been some 2050 watchers reporting to the Cabinet Office. The Cabinet Office presents the results of the surveys in the form of diffusion indexes.
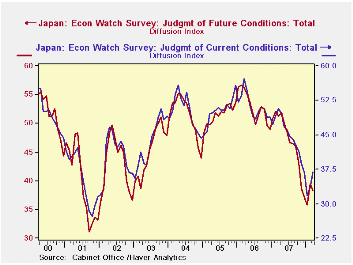
The Economy Watchers diffusion index for current conditions
rose for the second month reaching 36.9 in March from 33.6 in February
and 31.8 in January. The diffusion index for future conditions,
however, 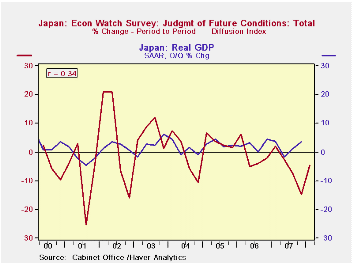 fell in March to 38.2, after showing the first rise in 9
months in February. The indexes of both current and future conditions
can be seen in the first chart.
fell in March to 38.2, after showing the first rise in 9
months in February. The indexes of both current and future conditions
can be seen in the first chart.
Expectations of lower future conditions were registered in every category except for retail sales where the diffusion index rose by a tenth of a percentage point. There are close correlations among the diffusion indexes of the various categories relating to current and future conditions. For example, the correlation between the indexes of future conditions for households and corporations is .94, as seen in the second chart. Similar high correlations are present in other combinations which suggests that all the Economy Watchers in the various lines of business have similar appraisals of current and future conditions.
As an indicator of trends in the whole economy, the Economy Watchers diffusion index of future conditions does not appear to be a particularly good forecaster. The final chart shows the quarterly changes in the diffusion index of future conditions and in GDP and the correlation (R) between the two series. The R2 which measures the degree to which the change in the GDP is accounted for by the change in the diffusion index is only 12%.
| JAPAN: ECONOMY WATCHERS SURVEY (Diffusion Indexes) | Mar 08 | Feb 08 | Mar 07 | M/M Chg | Y/Y Chg | 2007 | 2006 | 2005 |
|---|---|---|---|---|---|---|---|---|
| Current Conditions | ||||||||
| Total | 36.9 | 33.6 | 50.8 | 9.87 | -27.36 | 44.9 | 51.4 | 50.3 |
| Households | 37.4 | 33.1 | 79.9 | 12.99 | -25.05 | 44.0 | 49.8 | 49.0 |
| Corporations | 36.0 | 34.4 | 50.7 | 4.65 | -29.27 | 45.1 | 51.8 | 50.5 |
| Manufacturing | 35.5 | 34.5 | 48.7 | 2.90 | -27.10 | 44.6 | 50.1 | 48.8 |
| Non Manufacturing | 36.2 | 34.3 | 52.7 | 5.54 | -31.31 | 45.4 | 53.6 | 52.2 |
| Future Conditions | ||||||||
| Total | 38.2 | 39.5 | 51.3 | -3.29 | -25.54 | 46.9 | 52.9 | 51.5 |
| Households | 38.8 | 39.6 | 51.6 | -2.02 | -24.81 | 46.6 | 52.5 | 50.9 |
| Corporations | 36.1 | 38.6 | 47.9 | -6.48 | -24.63 | 45.8 | 51.7 | 50.6 |
| Manufacturing | 36.8 | 39.6 | 47.2 | -7.07 | -22.03 | 45.2 | 50.6 | 49.2 |
| Non Manufacturing | 35.2 | 37.4 | 48.6 | -5.88 | -27.57 | 46.4 | 52.9 | 52.1 |
by Tom Moeller April 8, 2008
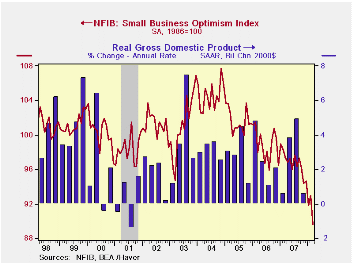
According to the National Federation of Independent Business (NFIB), small business optimism during March fell to the lowest level since 1980. The 3.6% m/m decline to a reading of 89.6 followed a modest 1.2% February rise. The drop lowered the level of sentiment 7.3% below the 2007 average and it was the lowest level since the short, "credit crunch" recession of 1980.
During the last ten years there has been a 70% correlation between the level of the NFIB index and the two quarter change in real GDP.
Seven percent of firms indicated that credit was harder to get. That was near the highs of the last several months and it was more than double the percentage during 2004.
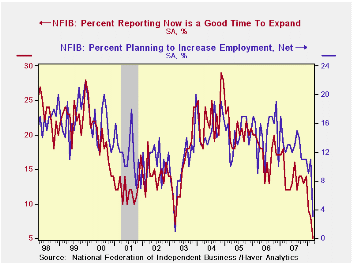
Twenty three percent fewer respondents in March expected the economy to improve and only three percent of the respondents expected to raise employment. That was the least since 2003. During the last ten years there has been a 72% correlation between the NFIB employment percentage and the y/y change in nonfarm payrolls.
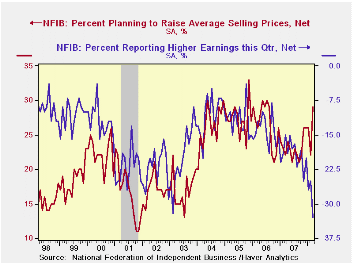
Only five percent of respondents thought that now was a good time to expand the business, the least since 1982, and expectations for earnings fell to the lowest level since 1982.
The percentage of firms actually raising
prices rose m/m to 18% which was the highest level since July of 2007.
During the last ten years there has been a 60% correlation between the
change in the producer price index and the level of the NFIB price
index. The percentage of firms planning to raise
prices also rose to 29%, its highest since August 2006.
About 24 million businesses exist in the United States. Small business creates 80% of all new jobs in America.
The NFIB figures can be found in Haver's SURVEYS database.
| Nat'l Federation of Independent Business | March | February | Y/Y | 2007 | 2006 | 2005 |
|---|---|---|---|---|---|---|
| Small Business Optimism Index (1986=100) | 89.6 | 92.9 | -7.9% | 96.7 | 98.9 | 101.6 |

Tom Moeller
AuthorMore in Author Profile »Prior to joining Haver Analytics in 2000, Mr. Moeller worked as the Economist at Chancellor Capital Management from 1985 to 1999. There, he developed comprehensive economic forecasts and interpreted economic data for equity and fixed income portfolio managers. Also at Chancellor, Mr. Moeller worked as an equity analyst and was responsible for researching and rating companies in the economically sensitive automobile and housing industries for investment in Chancellor’s equity portfolio. Prior to joining Chancellor, Mr. Moeller was an Economist at Citibank from 1979 to 1984. He also analyzed pricing behavior in the metals industry for the Council on Wage and Price Stability in Washington, D.C. In 1999, Mr. Moeller received the award for most accurate forecast from the Forecasters' Club of New York. From 1990 to 1992 he was President of the New York Association for Business Economists. Mr. Moeller earned an M.B.A. in Finance from Fordham University, where he graduated in 1987. He holds a Bachelor of Arts in Economics from George Washington University.
More Economy in Brief


