 Global| Jan 23 2008
U.S. Chain Store Sales Move Sideways
by:Tom Moeller
|in:Economy in Brief
Summary
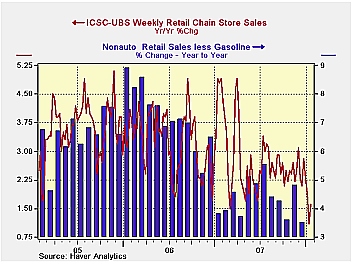
Chain store sales last week recovered 0.7% after a 0.9% decline during the prior period, according to the International Council of Shopping Centers (ICSC)-UBS.
Chain store sales last week recovered 0.7% after a 0.9% decline during the prior period, according to the International Council of Shopping Centers (ICSC)-UBS.
For the opening three weeks of the the year chain store sales were up 1.6% from the December average which rose 1.0% from November.During the last ten years there has been a 45% correlation between the y/y change in chain store sales and the change in nonauto retail sales less gasoline.
The ICSC-UBS retail chain-store sales index is constructed using the same-store sales (stores open for one year) reported by 78 stores of seven retailers: Dayton Hudson, Federated, Kmart, May, J.C. Penney, Sears and Wal-Mart.
The leading indicator of chain store sales from ICSC-UBS similarly opened 2008 with firm gains of 0.9% and 0.7% to lift the January average level so far up 0.9% from December which fell 0.3% from November.
| ICSC-UBS (SA, 1977=100) | 01/19/08 | 01/12/08 | Y/Y | 2007 | 2006 | 2005 |
|---|---|---|---|---|---|---|
| Total Weekly Chain Store Sales | 488.6 | 485.4 | 1.6 % | 2.8% | 3.3% | 3.6% |
by Tom Moeller January 23, 2008
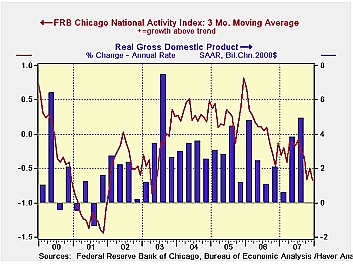
The National Activity Index (CFNAI) from the Federal Reserve Bank of Chicago during December, at -0.91, was negative for the fifth consecutive month after having been negative for virtually all of last year. The three month moving average of the index at -0.67 was its lowest since 2003.
The Chicago Fed indicated that each of the four broad categories of indicators— employment, production, consumption and housing—made negative contributions to the index last month.
A zero value of the CFNAI indicates that the economy is expanding at its historical trend rate of growth and during the last twenty years there has been a 68% correlation between the level of the CFNAI and q/q growth in real GDP.
The CFNAI is a weighted average of 85 indicators of economic activity. The indicators reflect activity in the following categories: production & income, the labor market, personal consumption & housing, manufacturing & trade sales, and inventories & orders.
The complete CFNAI report is available here.
Despite Increased Risks, Global Growth to Remain Solid in 2008 from the Federal Reserve Bank of Atlanta can be found here
| Chicago Fed | December | November | Dec. '06 | 2007 | 2006 | 2005 |
|---|---|---|---|---|---|---|
| CFNAI | -0.91 | -0.29 | -0.43 | -0.39 | 0.03 | 0.28 |
by Robert Brusca January 23, 2008
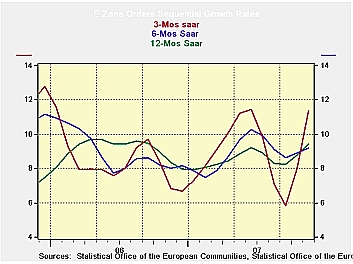
With various country indices showing slowing the EMU orders
aggregate for November rose and was surprisingly strong showing a gain
of 2.7% following a rise of 2.5% in Oct. Two months into Q4 data show
total MFG orders rising at a 17.6% annual rate. Domestic MFG orders in
the zone are up at a 13.8% pace while foreign orders are up at a 26.5%
pace. In Q4 German orders through November are up at a 28% pace while
in France, Italy and the UK results are much worse. French orders are
rising at a 1.2% annual rate, in Italy the pace is 7.1%. In the UK
industrial orders are dropping at a 31% annual rate in Q4.
Clearly the EU/EMU is seeing a great deal of irregularity
among members. Still, in January the ECB remains pre-occupied by
inflation risk and is not following the Fed in its rate-cutting
program. The orders data seem to confirm that there remains a core of
strength within the Euro Area but, at the same time we can wonder how
widespread it is and long lived it will be.
| E-zone-13 and UK Industrial Orders And Sales | |||||||||
|---|---|---|---|---|---|---|---|---|---|
| Saar except m/m | Mo/Mo | Nov-07 | Oct-07 | Nov-07 | Oct-07 | Nov-07 | Oct-07 | ||
| Ezone Detail | Nov-07 | Oct-07 | Sep-07 | 3-Mo | 3-Mo | 6-mo | 6-mo | 12-mo | 12-mo |
| Manufacturing Orders | 2.7% | 2.5% | -1.2% | 17.4% | 9.4% | 13.0% | 10.0% | 11.7% | 8.3% |
| Manufacturing Sales | -- | 0.1% | -0.2% | -- | -0.5% | -- | 3.7% | -- | 5.6% |
| Consumer Goods | -- | 0.2% | 0.2% | -- | 3.2% | -- | 4.1% | -- | 4.1% |
| Capital Goods | -- | 0.5% | 0.5% | -- | 6.8% | -- | 7.1% | -- | 8.1% |
| Intermediate Goods | 1.6% | 4.2% | -3.0% | 11.1% | 2.5% | 10.7% | 8.4% | 10.6% | 7.1% |
| Memo: MFG | |||||||||
| Total Orders | 2.7% | 2.5% | -1.2% | 17.4% | 9.4% | 13.0% | 10.0% | 11.7% | 8.3% |
| E-13 Domestic MFG orders | 1.6% | 4.2% | -3.0% | 11.1% | 2.5% | 10.7% | 8.4% | 10.6% | 7.1% |
| E-13 Foreign MFG orders | 3.9% | 2.4% | 0.0% | 27.8% | 18.6% | 14.8% | 13.5% | 13.6% | 11.2% |
| Countries: | Nov-07 | Oct-07 | Sep-07 | 3-Mo | 3-Mo | 6-mo | 6-mo | 12-mo | 12-mo |
| Germany (MFG): | 4.1% | 4.0% | -2.0% | 26.8% | 15.7% | 13.3% | 9.8% | 14.0% | 10.1% |
| France (Ind): | -0.2% | 2.4% | -2.5% | -1.3% | -4.5% | 2.7% | 7.9% | 7.9% | 6.4% |
| Italy (Ind): | 3.6% | -0.5% | 0.6% | 15.8% | -2.9% | 11.0% | 8.4% | 10.4% | 6.2% |
| UK (Engineering Ind): | -0.6% | -0.7% | -4.9% | -22.5% | -46.9% | 0.7% | 0.3% | 2.6% | 4.6% |

Tom Moeller
AuthorMore in Author Profile »Prior to joining Haver Analytics in 2000, Mr. Moeller worked as the Economist at Chancellor Capital Management from 1985 to 1999. There, he developed comprehensive economic forecasts and interpreted economic data for equity and fixed income portfolio managers. Also at Chancellor, Mr. Moeller worked as an equity analyst and was responsible for researching and rating companies in the economically sensitive automobile and housing industries for investment in Chancellor’s equity portfolio. Prior to joining Chancellor, Mr. Moeller was an Economist at Citibank from 1979 to 1984. He also analyzed pricing behavior in the metals industry for the Council on Wage and Price Stability in Washington, D.C. In 1999, Mr. Moeller received the award for most accurate forecast from the Forecasters' Club of New York. From 1990 to 1992 he was President of the New York Association for Business Economists. Mr. Moeller earned an M.B.A. in Finance from Fordham University, where he graduated in 1987. He holds a Bachelor of Arts in Economics from George Washington University.
More Economy in Brief


