 Global| Feb 12 2008
U.S. Chain Store Sales Fell, Gasoline Prices Down
by:Tom Moeller
|in:Economy in Brief
Summary
According to the International Council of Shopping Centers ICSC-UBS Chain store survey, chain store sales fell 0.7% last week after the 1.7% recovery during the prior period. Despite the decline, sales so far this month are up 0.5% [...]
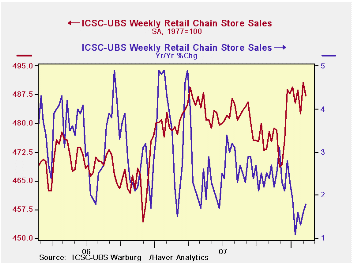
According to the International Council of Shopping Centers ICSC-UBS Chain store survey, chain store sales fell 0.7% last week after the 1.7% recovery during the prior period. Despite the decline, sales so far this month are up 0.5% from January.
During the last ten years there has been a 45% correlation between the y/y change in chain store sales and the change in nonauto retail sales less gasoline.The ICSC-UBS retail chain-store sales index is constructed using the same-store sales (stores open for one year) reported by 78 stores of seven retailers: Dayton Hudson, Federated, Kmart, May, J.C. Penney, Sears and Wal-Mart.
During the last week of January the leading indicator of chain store sales from ICSC-UBS ticked up 0.2% after the 1.8% w/w collapse during the prior week.
Prospects for the Economy in 2008 by Janet L. Yellen, President of the San Francisco Federal Reserve Bank, can be found here.
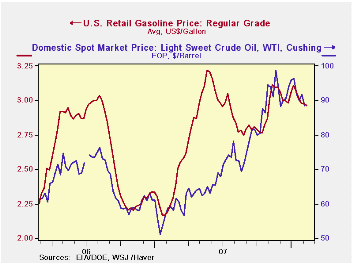
Retail gasoline prices recently moved further off the high reached last Spring of over $3.20 per gallon, according to the US Department of Energy survey.Last week the average retail price for regular grade gasoline fell to $2.96, down 8.0% from last year's peak in May. Prices did, however, remain up nearly 6% from an average of $2.80 last year.
The recent decline in gasoline prices owes mostly to the topping and decline in the price of crude oil. For spot WTI crude oil prices last week of $88.42 per barrel were down 10% from last year's high which nearly touched $100 per barrel.
| ICSC-UBS (SA, 1977=100) | 02/09/08 | 02/02/08 | Y/Y | 2007 | 2006 | 2005 |
|---|---|---|---|---|---|---|
| Total Weekly Chain Store Sales | 487.2 | 490.6 | 1.8% | 2.8% | 3.3% | 3.6% |
| Weekly Prices | 02/11/08 | 02/04/08 | Y/Y | 2007 | 2006 | 2005 |
|---|---|---|---|---|---|---|
| Retail Gasoline ($ per Gallon) | 2.96 | 2.98 | 32.1% | 2.80 | 2.57 | 2.27 |
| Light Sweet Crude Oil, WTI ($ per bbl.) | -- | 88.42 | 50.1% | 94.00 | 61.11 | 58.16 |
by Tom Moeller February 12, 2008
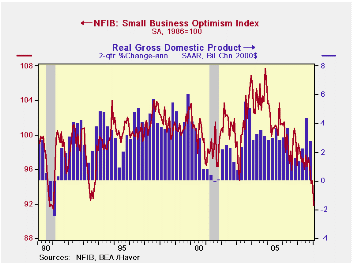
Small business optimism fell a sharp 3.0% last month according to the National Federation of Independent Business (NFIB). It was the largest m/m decline since December 2006 and it pulled optimism to the lowest level since during the recession of 1990.
During the last ten years there has been a 70% correlation between the level of the NFIB index and the two quarter change in real GDP.
Twenty two percent fewer respondents expected the economy to improve following declines during the prior three months. Only 9% reported that now is a good time to expand the business.
The percent planning to increase employment fell to its lowest level since early 2006 while the percentage with one or more job openings did recover further after November's sharp decline. During the last ten years there has been a 72% correlation between the NFIB percentage and the y/y change in nonfarm payrolls. The percentage of firms planning to raise employment remained depressed.
The percentage of firms planning to increase capital expenditures fell to the lowest level since 2002.
The percentage of firms expecting higher real sales in six months fell to 4%, the lowest level since 2003.
The percentage of firms actually raising prices fell sharply m/m to the lowest level since late 2006. During the last ten years there has been a 60% correlation between the change in the producer price index and the level of the NFIB price index. The percentage of firms planning to raise prices was stable for the third month at the highest level in a year.
About 24 million businesses exist in the United States. Small business creates 80% of all new jobs in America.
| Nat'l Federation of Independent Business | January | December | Y/Y | 2007 | 2006 | 2005 |
|---|---|---|---|---|---|---|
| Small Business Optimism Index (1986=100) | 91.8 | 94.6 | -7.2% | 96.7 | 98.9 | 101.6 |
by Tom Moeller February 12, 2008
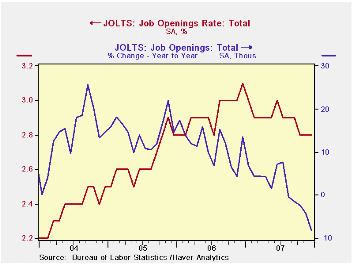
The Bureau of Labor Statistics reported in the Job Openings & Labor Turnover Survey (JOLTS) that the December '07 job openings rate was unchanged from the prior month at 2.8%. That level was, however, down from the highs of late 2006. The job openings rate is the number of job openings on the last business day of the month as a percent of total employment plus job openings.
The actual number of total job openings rose 0.4% m/m to 4.039 million but the number of job openings was down 8.2% last year from year end 2006. Professional & business service sector openings fell 8.5%, retail trade fell 22.7% while openings in manufacturing fell 15.2% y/y.
The hires rate fell m/m to 3.3%, its lowest level since 2004. The hires rate is the number of hires during the month divided by employment.
The actual number of hires fell 0.5% (-6.5% y/y) to 4.636 million. Last year, hires in the construction industry rose 3.5% but factory sector hires were 9.3% lower.
The job separations rate in December fell to 3.1% versus 3.3% at yearend 2006. Separations include quits, layoffs, discharges, and other separations as well as retirements. The level of job separations fell 4.1% since yearend 2006.
The JOLTS survey dates only to December 2000 but has since followed the movement in nonfarm payrolls, though the actual correlation between the two series is low.
A description of the Jolts survey and the latest release from the U.S. Department of Labor is available here.
| JOLTS (Job Openings & Labor Turnover Survey) | December | November | December '06 | 2007 | 2006 | 2005 |
|---|---|---|---|---|---|---|
| Job Openings, Total | ||||||
| Rate (%) | 2.8 | 2.8 | 3.1 | 2.8 | 3.1 | 2.8 |
| Total (000s) | 4,039 | 4,024 | 4,401 | 4,039 | 4,401 | 3,880 |
| Hires, Total | ||||||
| Rate (%) | 3.3 | 3.4 | 3.6 | 41.7 | 43.6 | 43.1 |
| Total (000s) | 4,636 | 4,657 | 4,959 | 57,659 | 59,409 | 57,508 |
by Louise Curley February 12, 2008
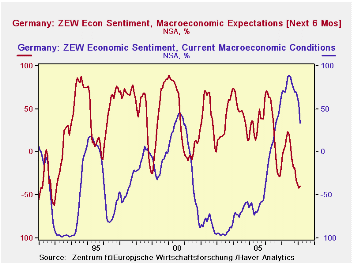
The German financial community has become slightly less pessimistic. For the first time since May of last year, the ZEW (Center for European Economic Research, Manheim) indicator of sentiment for the next six months rose. The rise was a mere 2.1 percentage points to -39.5% from -41.6% in January. The measure is still at its second lowest value it its history. The long term average for the indicator is 30.7%.
While the participants in the survey were slightly less pessimistic
about the future, they assessed the current situation much less
positively. The excess of optimists over pessimists regarding the
current situation fell 22.9 points from 56.6% to 33.7%. This was one of
the largest declines ever recorded.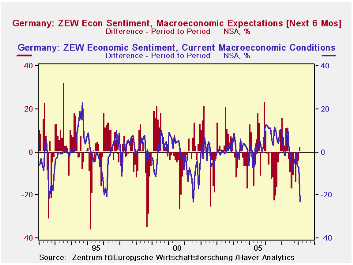
The absolute values for the appraisals of expectations and current conditions are shown in the first chart. Their month to month changes are shown in the second chart. Both charts cover the entire history of the indicators, so that the current values can be viewed in their historical perspectives. The appraisal of current conditions is slightly above its long term average while the appraisal of expectation remains among it lowest values.
In its press release, the Center for European Economic Research,
interpreted the decline in the number of pessimists over optimists
regarding the outlook as an indication that the current crisis is
unlikely to develop into a downward spiral for the German Economy,
rather it suggests that the economy might show some recovery by mid
year.
| ZEW INDICATORS (Percent Balance) | Feb 08 | Jan 08 | Feb 07 | M/M Dif | Y/Y Dif | 2007 | 2006 | 2005 |
|---|---|---|---|---|---|---|---|---|
| Expectations Six Months Ahead | -39.5 | -41.6 | 2.9 | 2.1 | -42.4 | 3.0 | 22.3 | 34.8 |
| Current Conditions | 33.7 | 56.6 | 70.9 | -22.9 | -37.2 | 75.9 | 18.8 | -61.8 |

Tom Moeller
AuthorMore in Author Profile »Prior to joining Haver Analytics in 2000, Mr. Moeller worked as the Economist at Chancellor Capital Management from 1985 to 1999. There, he developed comprehensive economic forecasts and interpreted economic data for equity and fixed income portfolio managers. Also at Chancellor, Mr. Moeller worked as an equity analyst and was responsible for researching and rating companies in the economically sensitive automobile and housing industries for investment in Chancellor’s equity portfolio. Prior to joining Chancellor, Mr. Moeller was an Economist at Citibank from 1979 to 1984. He also analyzed pricing behavior in the metals industry for the Council on Wage and Price Stability in Washington, D.C. In 1999, Mr. Moeller received the award for most accurate forecast from the Forecasters' Club of New York. From 1990 to 1992 he was President of the New York Association for Business Economists. Mr. Moeller earned an M.B.A. in Finance from Fordham University, where he graduated in 1987. He holds a Bachelor of Arts in Economics from George Washington University.
More Economy in Brief


