 Global| Feb 12 2010
U.S. Business Inventories Slip After Two-Month Increase
by:Tom Moeller
|in:Economy in Brief
Summary
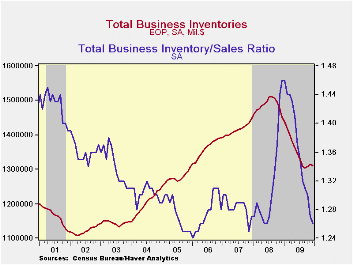
A developing trend towards accumulation of business inventories was cut short in December. The 0.2% yearend decline partially reversed gains during the prior two months which were the first in over a year. For the year business [...]
 A developing
trend towards accumulation of business inventories was cut short in
December. The 0.2% yearend decline partially reversed gains during the
prior two months which were the first in over a year. For the year
business inventories fell a record 9.7% as prices and volumes declined.
Perhaps the earlier accumulation resulted from slower sales growth.
Business sales in December were below the pace during three of the
prior four months. As a result, the inventory/sales ratio fell back to
the cycle low of 1.26 from a January '09 high of 1.46.
A developing
trend towards accumulation of business inventories was cut short in
December. The 0.2% yearend decline partially reversed gains during the
prior two months which were the first in over a year. For the year
business inventories fell a record 9.7% as prices and volumes declined.
Perhaps the earlier accumulation resulted from slower sales growth.
Business sales in December were below the pace during three of the
prior four months. As a result, the inventory/sales ratio fell back to
the cycle low of 1.26 from a January '09 high of 1.46.
Lower
manufacturing and wholesale inventories led the December decline after
earlier gains which, in the case of wholesalers, was led by higher
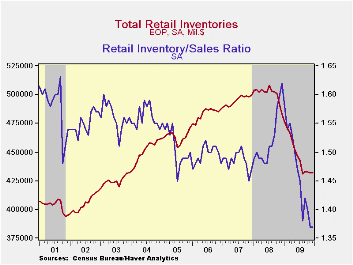 petroleum prices. Total retail inventories were unchanged
after steady declines since August 2008. Cuts last month were led by
food & beverage stores with a 1.5% (-0.6% y/y) decline.
Elsewhere, inventory cutting slowed from earlier strong declines.
Furniture inventories even have risen during three of the last four
months while clothing and general merchandise inventories are falling
at slower rates. Auto dealer inventories slipped m/m and are down by
one-quarter y/y.
petroleum prices. Total retail inventories were unchanged
after steady declines since August 2008. Cuts last month were led by
food & beverage stores with a 1.5% (-0.6% y/y) decline.
Elsewhere, inventory cutting slowed from earlier strong declines.
Furniture inventories even have risen during three of the last four
months while clothing and general merchandise inventories are falling
at slower rates. Auto dealer inventories slipped m/m and are down by
one-quarter y/y.
Retailers' inventory/sales ratio fell to a new cycle low with sales gains and little inventory growth. The I/S ratio for department stores led the decline with little increase elsewhere. Wholesalers' ratio also fell to a near-record low while the I/S ratio in the factory sector fell to the lowest level since July 2008.
The business sales and inventory data are available in Haver's USECON database.
| Business Inventories (%) | December | November | October | Y/Y | 2009 | 2008 | 2007 |
|---|---|---|---|---|---|---|---|
| Total | -0.2 | 0.5 | 0.3 | -9.7 | -9.7 | 0.4 | 4.0 |
| Retail | 0.0 | -0.2 | -0.0 | -10.6 | -10.6 | -3.3 | 2.5 |
| Retail excl. Auto | 0.2 | -0.3 | -0.2 | -5.1 | -5.1 | -1.9 | 2.7 |
| Wholesale | -0.8 | 1.6 | 0.6 | -10.2 | -10.2 | 2.5 | 6.2 |
| Manufacturing | -0.1 | 0.2 | 0.4 | -8.6 | -8.6 | 2.2 | 3.7 |

Tom Moeller
AuthorMore in Author Profile »Prior to joining Haver Analytics in 2000, Mr. Moeller worked as the Economist at Chancellor Capital Management from 1985 to 1999. There, he developed comprehensive economic forecasts and interpreted economic data for equity and fixed income portfolio managers. Also at Chancellor, Mr. Moeller worked as an equity analyst and was responsible for researching and rating companies in the economically sensitive automobile and housing industries for investment in Chancellor’s equity portfolio. Prior to joining Chancellor, Mr. Moeller was an Economist at Citibank from 1979 to 1984. He also analyzed pricing behavior in the metals industry for the Council on Wage and Price Stability in Washington, D.C. In 1999, Mr. Moeller received the award for most accurate forecast from the Forecasters' Club of New York. From 1990 to 1992 he was President of the New York Association for Business Economists. Mr. Moeller earned an M.B.A. in Finance from Fordham University, where he graduated in 1987. He holds a Bachelor of Arts in Economics from George Washington University.
More Economy in Brief


