 Global| May 13 2005
U.S. Business Inventories Rose
by:Tom Moeller
|in:Economy in Brief
Summary
Total business inventories rose 0.4% in March and the y/y rate of inventory accumulation continued strong at 7.9%. The ratio of inventories-to-sales fell slightly, however, and returned to the record low average of last year. Retail [...]
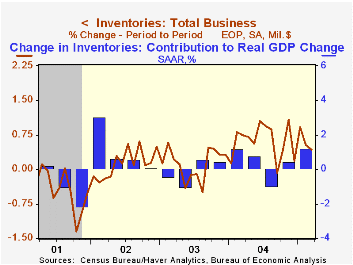
Total business inventories rose 0.4% in March and the y/y rate of inventory accumulation continued strong at 7.9%. The ratio of inventories-to-sales fell slightly, however, and returned to the record low average of last year.
Retail inventories rose 0.3% in March and also gained 0.3% excluding autos. Inventories of furniture & electronics increased 0.6% (6.2% y/y) following two months of decline and general merchandise doubled the prior month's increase with a 1.0% surge (6.6% y/y). Apparel inventories rose 0.5% (4.3% y/y).
Factory sector inventories grew 0.6% for the second month and the 8.9% increase versus last year remained the strongest since 1989.
Wholesale inventory accumulation moderated to 0.4%. During the last ten years there has been a 64% correlation between the y/y change in wholesale inventories and the change in imports of merchandise.
Overall business sales recovered 0.7% (6.7% y/y) after the 0.5% decline in February.
| Business Inventories | March | Feb | Y/Y | 2004 | 2003 | 2002 |
|---|---|---|---|---|---|---|
| Total | 0.4% | 0.5% | 7.9% | 7.7% | 1.4% | 1.6% |
| Retail | 0.3% | 0.4% | 4.8% | 5.7% | 3.9% | 5.9% |
| Retail excl. Autos | 0.3% | 0.5% | 6.5% | 5.9% | 2.0% | 2.3% |
| Wholesale | 0.4% | 0.6% | 10.8% | 10.8% | 2.0% | 1.2% |
| Manufacturing | 0.6% | 0.6% | 8.9% | 7.5% | -1.3% | -1.8% |
by Tom Moeller May 13, 2005
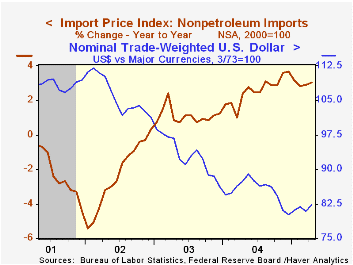
Import prices surged 0.8% last month following an upwardly revised 2.0% spike in March. Consensus expectations had been for a moderate 0.3% increase.
Petroleum prices jumped another 3.1% m/m and the March gain was revised up. While crude oil moderated and rose just 1.0%, a 9.9% jump in "other" petroleum product prices and a 12.4% gain gas prices lifted the fuel total. So far in May the price of Brent Crude oil has traded roughly 5% below the April average of $52.22 per barrel and yesterday touched $46.63.
Import prices other than petroleum rose 0.4% last month and again mostly reflected strength in prices of foods & beverages (0.4% m/m, 8.5% y/y) and in prices for industrial supplies & materials less petroleum (2.1% m/m, 11.5% y/y).
During the last ten years there has been a 66% (negative) correlation between the nominal trade-weighted exchange value of the US dollar vs. major currencies and the y/y change in non oil import prices. The correlation is a lower 47% against a broader basket of currencies and a lower 57% against the real value of the dollar. 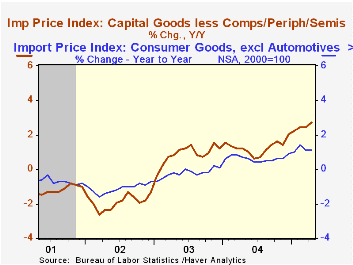
Prices for nonauto consumer goods fell 0.1% (+1.1% y/y) for the second down month and capital goods prices fell 0.1% (-0.5% y/y) for the third down month. Imported computer prices fell 1.1% (-7.1% y/y) although excluding computers capital goods prices rose a firm 0.3% (2.7% y/y).
Export prices again rose 0.6% on the strength of a 1.9% (14.0% y/y) surge in industrial materials.
| Import/Export Prices (NSA) | April | March | Y/Y | 2004 | 2003 | 2002 |
|---|---|---|---|---|---|---|
| Import - All Commodities | 0.8% | 2.0% | 8.1% | 5.6% | 2.9% | -2.5% |
| Petroleum | 3.1% | 12.3% | 43.1% | 30.5% | 21.0% | 3.0% |
| Non-petroleum | 0.4% | 0.3% | 3.0% | 2.6% | 1.1% | -2.4% |
| Export - All Commodities | 0.6% | 0.6% | 3.1% | 3.9% | 1.6% | -1.0% |
by Tom Moeller May 13, 2005

The University of Michigan's reading of consumer sentiment in May fell 2.7% from April to 85.3. The decline contrasted to Consensus expectations for stability at 88.0.
Sentiment has fallen in each of the last five months and is down 17.8% from the January '04 peak. During the last ten years there has been a 75% (inverse) correlation between the level of consumer sentiment and the y/y change in real PCE, although the correlation has fallen in recent years.
Consumer expectations were depressed mostly by a sense that unemployment would rise which generated expectations that real family income would decline, helped lower by an expected acceleration in price inflation.
The reading of current economic conditions fell 1.1% for the fourth consecutive monthly drop and reflected a sharp decline in the reading of personal finances to the lowest level since December 2003.
The University of Michigan survey is not seasonally adjusted.The mid-month survey is based on telephone interviews with 250 households nationwide on personal finances and business and buying conditions. The survey is expanded to a total of 500 interviews at month end.
| University of Michigan | May | April | Y/Y | 2004 | 2003 | 2002 |
|---|---|---|---|---|---|---|
| Consumer Sentiment | 85.3 | 87.7 | -5.4% | 95.2 | 87.6 | 89.6 |
| Current Conditions | 103.3 | 104.4 | -0.3% | 105.6 | 97.2 | 97.5 |
| Consumer Expectations | 73.7 | 77.0 | -9.7% | 88.5 | 81.4 | 84.6 |
by Carol Stone May 13, 2005
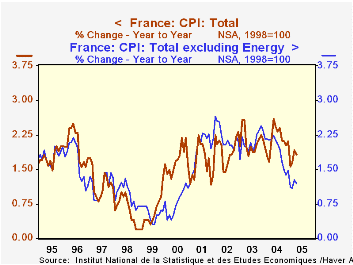
A recurrent theme of our reports over the last couple of months has been the continuation of low consumer price inflation despite high energy prices. This phenomenon has persisted through April in several European countries that reported their latest CPI data today.
This is especially evident in France, where the total CPI has even slowed somewhat in the face of the recent surge in energy costs. The first four months of 2005 averaged year-on-year inflation of 1.8%, compared with a five-year average of 2.0%. Food is cheaper, clothing prices are little changed and manufactured goods have declined outright. Services prices have been rising 2.7%, but this is less than their 3%+ pace in 2002.
In Finland and Sweden, which we mentioned here a month ago, the 12-month change in total CPI ticked up by 0.1% and 0.2%, respectively from their March rates. But that still leaves Finland at 1.1% and Sweden at a mere 0.3%. In Spain, total inflation was 3.5% year-on-year in April, with some signs of upward creep. But the pace excluding energy has been steady at 2.9% for the last two years.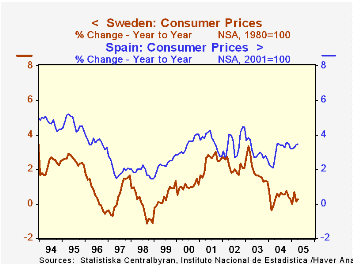
Perhaps we are simply short-sighted in these comments; perhaps it simply takes longer than a year for the "second-round" effects of sustained energy prices to filter through to other items. Or perhaps, as we noted elsewhere recently, the second-round effects will appear more as restraints to demand growth than spurs to higher inflation.
| Yr/Yr % Changes Not Seasonally Adjusted |
Apr 2005 | Mar 2005 | Feb 2005 | December/December|||
|---|---|---|---|---|---|---|
| 2004 | 2003 | 2002 | ||||
| France | 1.8 | 1.9 | 1.6 | 2.1 | 1.2 | 2.3 |
| Finland | 1.1 | 1.0 | 0.2 | 0.4 | 0.6 | 1.7 |
| Sweden | 0.3 | 0.1 | 0.7 | 0.3 | 1.3 | 2.1 |
| Spain | 3.5 | 3.4 | 3.3 | 3.2 | 2.6 | 4.5 |
| US | -- | 3.1 | 3.0 | 3.3 | 1.9 | 2.4 |

Tom Moeller
AuthorMore in Author Profile »Prior to joining Haver Analytics in 2000, Mr. Moeller worked as the Economist at Chancellor Capital Management from 1985 to 1999. There, he developed comprehensive economic forecasts and interpreted economic data for equity and fixed income portfolio managers. Also at Chancellor, Mr. Moeller worked as an equity analyst and was responsible for researching and rating companies in the economically sensitive automobile and housing industries for investment in Chancellor’s equity portfolio. Prior to joining Chancellor, Mr. Moeller was an Economist at Citibank from 1979 to 1984. He also analyzed pricing behavior in the metals industry for the Council on Wage and Price Stability in Washington, D.C. In 1999, Mr. Moeller received the award for most accurate forecast from the Forecasters' Club of New York. From 1990 to 1992 he was President of the New York Association for Business Economists. Mr. Moeller earned an M.B.A. in Finance from Fordham University, where he graduated in 1987. He holds a Bachelor of Arts in Economics from George Washington University.
More Economy in Brief


