 Global| Dec 14 2009
U.S. Business Inventories' GainThe First Since 2008
by:Tom Moeller
|in:Economy in Brief
Summary
As the downward momentum in business sales recently slackened, so too did businesses' attitude toward holding inventories. In constant dollars, during 3Q '09 inventory cuts turned into accumulation that added 0.9 percentage points to [...]
As the downward momentum in business sales recently slackened, so too did businesses' attitude toward holding inventories. In constant dollars, during 3Q '09 inventory cuts turned into accumulation that added 0.9 percentage points to real GDP growth. In October the turn continued as business inventories rose 0.2%, the first monthly increase since last year. The gain followed a slightly revised 0.5% September drop. Consensus expectations were for a 0.2% decline.
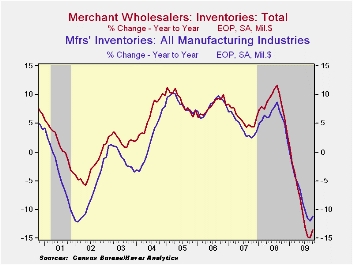
 Inventory accumulation last month was apparent in the factory
and wholesale sectors. Wholesale inventories rose 0.3% but the gain was
largely driven by a 4.6% (+24.1% y/y) increase in petroleum
inventories. Elsewhere, accumulation was limited. In the factory
sector, inventories posted a modest 0.4% increase after a 1.4% drop.
However, the increase also was primarily driven by a 6.4% jump in
petroleum inventories.
Inventory accumulation last month was apparent in the factory
and wholesale sectors. Wholesale inventories rose 0.3% but the gain was
largely driven by a 4.6% (+24.1% y/y) increase in petroleum
inventories. Elsewhere, accumulation was limited. In the factory
sector, inventories posted a modest 0.4% increase after a 1.4% drop.
However, the increase also was primarily driven by a 6.4% jump in
petroleum inventories.
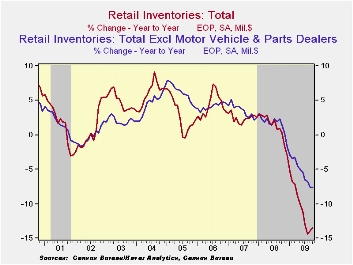
Retail inventories were unchanged during October as motor vehicle inventories rose 0.6% (-26.6% y/y) after a 4.1% September increase. Furniture inventories also increased by 1.0% (-11.1% y/y) after a 0.2% rise during September. Elsewhere, retail inventories continued to decline, but at a slower rate. Clothing inventories fell 0.6% (-11.3% y/y) which was less than the 1.8% September drop. General merchandise inventories fell negligibly (-6.3% y/y) following a 0.5% September decline. Inventories at building materials and garden supply stores fell 0.7% (-10.1% y/y) after a reduced 0.4% September decline.
 For the fifth straight month, business sales rose and the 1.1%
(-8.2% y/y) increase reflected across-the-board gains. Retail sales
rose 1.3% during October and increased another 1.4% last month. Sales
of merchant wholesalers were quite strong for the third month although
much of the increase reflects higher oil prices. Factory shipments
jumped 3.5% (-1.2% y/y) but again, a 7.0% rise petroleum shipments
accounted for much of the total gain.
For the fifth straight month, business sales rose and the 1.1%
(-8.2% y/y) increase reflected across-the-board gains. Retail sales
rose 1.3% during October and increased another 1.4% last month. Sales
of merchant wholesalers were quite strong for the third month although
much of the increase reflects higher oil prices. Factory shipments
jumped 3.5% (-1.2% y/y) but again, a 7.0% rise petroleum shipments
accounted for much of the total gain.
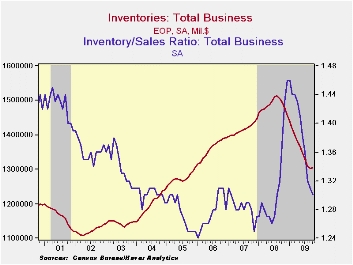
Despite a possible interest in slowing the rate of inventory cutbacks, the inventory-to-sales ratio for total business fell to a cycle low of 1.30 versus a high of 1.46 in January. The latest was the lowest since last September. In the retail sector the ratio fell and reversed the September increase. For manufacturers and wholesalers, the ratio fell to new cycle lows.
The business sales and inventory data are available in Haver's USECON database.
Visit the Wall Street Journal's Blog Remembering Paul Samuelson
| Business Inventories (%) | October | September | August | Y/Y | 2008 | 2007 | 2006 |
|---|---|---|---|---|---|---|---|
| Total | 0.2 | -0.5 | -1.6 | -12.6 | 0.6 | 4.0 | 6.4 |
| Retail | 0.0 | 0.5 | -2.6 | -13.5 | -3.1 | 2.5 | 3.3 |
| Retail excl. Auto | -0.2 | -0.7 | -0.7 | -7.6 | -1.8 | 2.7 | 4.7 |
| Wholesale | 0.3 | -0.8 | -1.3 | -13.5 | 3.1 | 6.2 | 8.2 |
| Manufacturing | 0.4 | -1.3 | -0.9 | -11.2 | 2.1 | 3.7 | 8.2 |
EMU MFG Progress Hits The Skids.... More Questions Arise In Japan Despite Improved Tankan
by Robert Brusca December 14, 2009
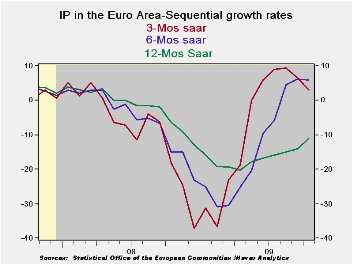
Industrial output in EMU has backtracked. The 0.3% drop in October flattens out progress in the sector and leaves manufacturing IP flat in the fourth quarter compared to its level in Q3. Consumer goods output is off sharply in the new quarter while capital goods output is strongly higher. Intermediate goods output is up sharply.
Among the five largest EU economics only Spain saw a rise in IP month-to-month in October. Still three month growth rates are up for the zone and are strong for the Big Five except for a 1.8% annual rate drop in the UK and a horrific-looking -20.2% from Spain whose numbers are notoriously volatile (Spain’s three month growth rate for IP was UP by 28% in Sept, just one month ago).
Japan’s TankanIn Asia Japan has reported out its Tankan results for December. Its large company index rose by a solid nine points and exceeded the forecasts of economists. Still at a raw reading of -24 it clearly says that large corporate respondents are still more negative than positive in this Tankan diffusion presentation. Even if they are less negative than they were last quarter the results are far from satisfying. Firms in Japan are engaging in deeper spending cuts to stay alive in a still-tough economy. Japan has slipped back into the grip of deflation something that tends to make businessmen more defense-minded- that is not the way to mount a recovery. With the yen still so strong it is hard for Japan to export itself to prosperity. Paradoxically Japanese firms continue to engage in outsourcing with Sony making a new announcement to that effect transferring work to China. While outsourcing may solve the firm’s problems it does not help Japan out of its economic difficulties.
The global recoveryOn balance world trade is making some recovery and that is helping trade-dependent countries like Japan to do better. But Japan is still beset with problems and large block of pubic indebtedness that keeps its government from engaging in too much in the way of pump-priming expenditures. Europe is having a simple slip but its broader growth rates tell a story of slowing that transcends one monthly report. When central bankers and national leaders say that they are still concerned about the economy and that there is a risk of backsliding and that it is too soon to take away the special stimulus brought forward in the crisis… this is the sort of report that brings those concerns to life.
Treatment of the heroes of the crisisAgainst this background we have to wonder about the all the flack being shoveled onto Fed Chairman Ben Bernanke’s plate. Bernanke’s efforts bolstered not just the US, but the world economy. Do the Fed bashers on the House and Senate banking committees really have any idea what they are protesting when they go after Gentile Ben? It was the fall in standards and directions imposed on markets by the law makers who put political agendas ahead of smart business practices as much as anything that got us into this mess. Now we can see that despite huge government and central banker efforts around the world the path to recovery remains tentative. The US Congress is deeply involved in a witch hunt for scapegoats. The Fed Chairman is a more convenient a target than he is to blame. But with an angry electorate in the US and the next election cycle looming a scapegoat is a prime need for politicians.
| EURO-AREA MFG IP | ||||||||||
|---|---|---|---|---|---|---|---|---|---|---|
| Saar except m/m | Mo/Mo | Oct-09 | Sep-09 | Oct-09 | Sep-09 | Oct-09 | Sep-09 | |||
| Euro-Area Detail | Oct-09 | Sep-09 | Aug-09 | 3-Mo | 3-Mo | 6-mo | 6-mo | 12-mo | 12-mo | Q-4 |
| MFG | -0.3% | 0.3% | 0.3% | 1.3% | 2.5% | 1.4% | 0.6% | -12.1% | -13.7% | 0.0% |
| Consumer | -1.7% | 0.1% | -0.5% | -8.3% | -0.2% | -3.5% | 0.6% | -5.4% | -3.7% | -10.5% |
| C-Durables | -1.4% | -5.1% | 5.1% | -6.3% | 1.3% | -12.9% | -9.2% | -18.0% | -18.2% | -- |
| C-Non-durables | -1.6% | 0.7% | -1.2% | -8.1% | -0.6% | -2.2% | 1.9% | -3.3% | -1.5% | -- |
| Intermediate | 1.2% | 1.0% | 1.1% | 13.7% | 15.4% | 15.6% | 12.6% | -12.8% | -16.0% | 13.9% |
| Capital | 0.0% | 1.5% | 1.6% | 12.8% | 6.9% | 6.2% | 3.4% | -16.8% | -18.7% | 9.3% |
| Main Euro-Area Countries and UK IP in MFG | ||||||||||
| Mo/Mo | Oct-09 | Sep-09 | Oct-09 | Sep-09 | Oct-09 | Sep-09 | ||||
| MFG Only | Oct-09 | Sep-09 | Aug-09 | 3-Mo | 3-Mo | 6-mo | 6-mo | 12-mo | 12-mo | Q:4-Date |
| Germany: | -1.6% | 3.7% | 2.1% | 17.6% | 20.8% | 19.1% | 16.1% | -13.5% | -13.9% | 9.0% |
| France:IPxConstruct'n | -0.8% | -1.2% | 3.0% | 3.7% | 9.0% | 7.9% | 6.6% | -8.4% | -10.6% | -3.8% |
| Italy | 0.8% | -5.4% | 6.0% | 4.4% | 6.0% | 4.4% | 4.0% | -13.7% | -16.5% | -5.8% |
| Spain | -3.0% | 0.5% | -3.0% | -20.2% | 28.0% | -0.2% | 19.0% | -13.0% | -12.6% | -20.4% |
| UK: EU member | 0.0% | 1.6% | -2.0% | -1.8% | 0.5% | -0.4% | -0.4% | -7.8% | -9.8% | 2.3% |
A Pause In Economic Activity In The European Union
by Louise Curley December 14, 2009
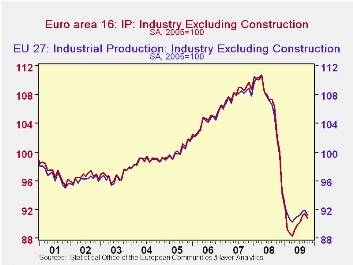
After rising for five consecutive months, industrial production fell 0.6% in the Euro Area in October and 0.7% in the entire European Union. The attached chart shows the index of Industrial Production (2005=100) for the Euro Area and the European Union. There is a spurious correlation between the two series due the fact that the EU series includes the EA series. As with much of the data on the Euro Area and the European Union it is not possible to derive a non Euro Area part of the European Union.
Not all of the countries of the European Union have reported October data. Euro stat's totals for the Euro Area and the European Union include their estimates of the missing data and these estimates are not published. The totals are, therefore, preliminary and frequently revised.
In the Euro Area, the big three--Germany experienced a 1.8% decline in industrial production, France, a 0.9% decline and Italy, a 0.5% increase. Declines were recorded in Ireland, 2.8%, Greece, 0.8%, Portugal, 1.4%. The biggest decline in production in the Euro area, that of Slovenia, was 3.2%. The largest increase in production in the Euro Area was in Finland at 2.2%.
Of the published data, among the non Euro Area countries, industrial production in the UK declined 0.1%, and in Sweden, 0.5%. Industrial Production in Latvia and Lithuania increased 0.1% and 0.4% respectively. Production in Bulgaria rose 2.1%, the first increase since September, 2008.
| Industrial Production (2005=100) | Oct 09 | Sep 09 | Aug 09 | Jul 09 | Jun 09 | May 08 | Apr 08 |
|---|---|---|---|---|---|---|---|
| European Area (m/m % change) | -0.73 | 0.12 | 0.68 | 0.18 | 0.32 | 0.53 | -0.39 |
| European Union (m/m % change) | -0.61 | 0.21 | 1.13 | 0.26 | 0.86 | 1.06 | -0.47 |
| Bulgaria | 2.1 | -3.6 | -0.21 | -0.5 | -0.6 | -1.4 | -0.1 |
| Slovenia | -3.2 | 0.7 | 8.0 | -0.6 | 0.3 | 2.9 | -4.2 |
| Ireland | -2.8 | 11.3 | -16.0 | 7.9 | 7.3 | -3.6 | -3.5 |
| Finland | 2.2 | -1.7 | 2.4 | -1.6 | 1.5 | -0.7 | -1.9 |

Tom Moeller
AuthorMore in Author Profile »Prior to joining Haver Analytics in 2000, Mr. Moeller worked as the Economist at Chancellor Capital Management from 1985 to 1999. There, he developed comprehensive economic forecasts and interpreted economic data for equity and fixed income portfolio managers. Also at Chancellor, Mr. Moeller worked as an equity analyst and was responsible for researching and rating companies in the economically sensitive automobile and housing industries for investment in Chancellor’s equity portfolio. Prior to joining Chancellor, Mr. Moeller was an Economist at Citibank from 1979 to 1984. He also analyzed pricing behavior in the metals industry for the Council on Wage and Price Stability in Washington, D.C. In 1999, Mr. Moeller received the award for most accurate forecast from the Forecasters' Club of New York. From 1990 to 1992 he was President of the New York Association for Business Economists. Mr. Moeller earned an M.B.A. in Finance from Fordham University, where he graduated in 1987. He holds a Bachelor of Arts in Economics from George Washington University.
More Economy in Brief


