 Global| Jul 13 2005
U.S. Budget Surplus in June, Estimates Reduced
by:Tom Moeller
|in:Economy in Brief
Summary
The U.S. federal government ran a budget surplus of $22.2B in June that was in line with Consensus estimates. The monthly surplus kept the deficit during the first nine months of FY 2005 on a pace that was nearly one quarter below the [...]
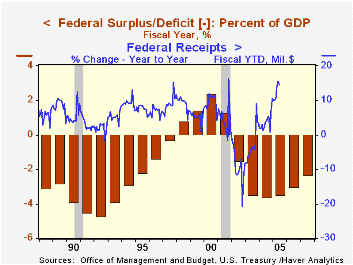
The U.S. federal government ran a budget surplus of $22.2B in June that was in line with Consensus estimates. The monthly surplus kept the deficit during the first nine months of FY 2005 on a pace that was nearly one quarter below the prior fiscal year's first nine months.
Net receipt growth at 14.6% for the first nine months of FY05 continued to reflect the improved economy. Individual income taxes (44% of total receipts) rose 16.3% and corporate income taxes (10% of total receipts) were strong, up 41.0%. The improved job market raised employment taxes (36% of total receipts) by 8.0%, up from 1.2% growth last year, and excise taxes grew 4.0%.
Federal outlay growth inched up to 7.3% during the first nine months of FY05 as defense spending (19% of total outlays) grew 7.1% and Medicare spending (12% of total outlays) was strong at 9.6%. Growth in spending on social security (21% of total outlays) crept up to 5.5% and spending on health programs (10% of the total) increased 4.1%. Spending on education & training (4% of the total) increased 16.0% and interest expense (8% of the total) grew 13.1% with higher interest rates versus declines last year.
White House projections of future budget deficits were updated today by the Office of Management & Budget. The estimated deficit for FY2005 was lowered to $333B (2.7% of GDP) from the February estimate of $427B (3.5% of GDP) and the estimated deficit next year was lowered to $341B (2.6% of GDP) from $390B (3.0% of GDP).
A higher estimated level of Federal tax receipts, notwithstanding reduced tax rates, offset a higher level of War funding. The economic assumptions (GDP, CPI, & the Unemployment Rate) were little changed from February.
The Mid-Session Review of the 2006 Budget of the US Government by the Office of Management and Budget is available here.
| US Government Finance | June | May | FY '05 - YTD | FY2004 | FY2003 | FY2002 |
|---|---|---|---|---|---|---|
| Budget Balance | $22.4B | $-35.3B | $-249.8B | $-412.1B | $-377.6B | $-157.8B |
| Net Revenues | $234.8B | $152.7B | 14.6% | 5.5% | -3.8% | -6.9% |
| Net Outlays | $212.4B | $188.0B | 7.3% | 6.1% | 7.4% | 7.9% |

Tom Moeller
AuthorMore in Author Profile »Prior to joining Haver Analytics in 2000, Mr. Moeller worked as the Economist at Chancellor Capital Management from 1985 to 1999. There, he developed comprehensive economic forecasts and interpreted economic data for equity and fixed income portfolio managers. Also at Chancellor, Mr. Moeller worked as an equity analyst and was responsible for researching and rating companies in the economically sensitive automobile and housing industries for investment in Chancellor’s equity portfolio. Prior to joining Chancellor, Mr. Moeller was an Economist at Citibank from 1979 to 1984. He also analyzed pricing behavior in the metals industry for the Council on Wage and Price Stability in Washington, D.C. In 1999, Mr. Moeller received the award for most accurate forecast from the Forecasters' Club of New York. From 1990 to 1992 he was President of the New York Association for Business Economists. Mr. Moeller earned an M.B.A. in Finance from Fordham University, where he graduated in 1987. He holds a Bachelor of Arts in Economics from George Washington University.
More Economy in Brief


