 Global| Jan 14 2008
U.S. Budget Deficit Deeper in 1Q FY08: Growth in Receipts Down, Outlays Up
by:Tom Moeller
|in:Economy in Brief
Summary
The U.S. government ran a budget surplus this past December of $48.261B, about the same as during December of 2006. These two figures were improved from the December deficits of the prior two years. For the first three months of FY08, [...]
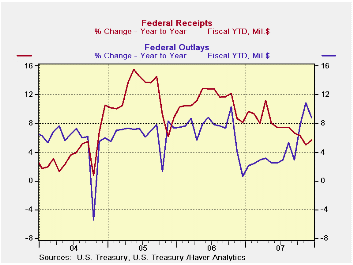
The U.S. government ran a budget surplus this past December of $48.261B, about the same as during December of 2006. These two figures were improved from the December deficits of the prior two years.
For the first three months of FY08, however, the government's budget deficit deepened to $105.5B versus a deficit of $80.4B during the first three months of FY07.
Federal receipts grew 5.7% y/y, a slowdown from the 8.2% y/y growth during the first three months FY07. Growth in individual income tax receipts (44% of total receipts) continued steady at 9.1%. Withheld income taxes grew 10.5%, which was an acceleration from 8.3% growth early last fiscal year, but non-withheld taxes fell 4.0% versus 28.3% growth during the first three months of FY07.
As a result of the slowdown in corporate profit growth, growth corporate income taxes (13% of total receipts) showed a shortfall of -1.0% versus an 18.6% gain in FY07. Employment & general retirement contributions picked up to a 6.9% rate of growth from 3.7% but unemployment insurance receipts fell 6.4%, about the same as during the prior fiscal year.
U.S. net outlays grew 4.9%, reversing a y/y decline of 5.6% in early FY07. Growth in defense spending (19% of total outlays) eased to 2.1% from 3.8% and Medicare expenditures (12% of outlays) fell 33.4%, but spending in many other categories picked up: agriculture, transportation, health, income security, justice administration and interest, with the rise in interest rates. Growth in social security spending (21% of outlays) held about steady at 6.3%.The Government's financial data is available in Haver's USECON database.
Monetary Policy Flexibility, Risk Management, and Financial Disruptions is Friday's speech by GovernorFrederic S. Mishkin and it can be found here.
| US Government Finance | December | November | Y/Y | FY 2007 | FY 2006 | FY 2005 |
|---|---|---|---|---|---|---|
| Budget Balance | $48.261B | $-98.238B | $41.961B (12/06) |
-$162.8B | -$248.2B | -$318.7B |
| Net Revenues | $277.0B | $151.1B | 6.5% | 6.7% | 11.8% | 14.1% |
| Net Outlays | $228.7B | $249.3B | 4.9% | 2.8% | 7.4% | 7.6% |
by Louise Curley January 14, 2008
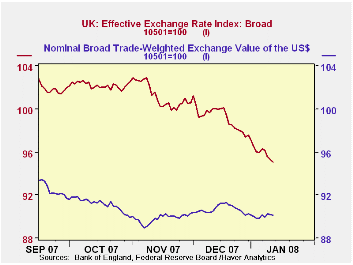
In recent months, the British Pound has taken a sharp fall. From its peak of 102.89 (January, 2005 = 100) in early November, the Broad Effective Exchange rate of the British pound had declined 7.6% by last Friday. By contrast, during this time, the Broad Effective Exchange rate of the US dollar rose 0.56% from 89.63 to 90.13. The first chart compares the effective exchange rates of the two countries. The inflationary implications of decline in the pound are likely to complicate monetary policy.
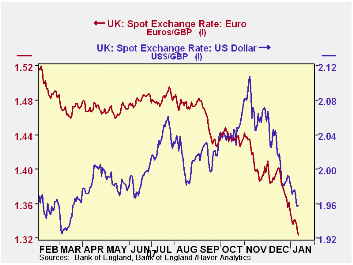
The pound has depreciated somewhat more against the euro than the dollar. From the November peak of 1.43 euros, the pound declined 8.3% to 1.32 euros on January 11, while the pound declined 7.1% from the peak of $2.11 to $1.96 over the same period. The value of the pound in dollar and euro terms is shown in the second chart. The sharp decline in the pound relative to the euro is likely to have a dampening effect on the Euro Area's exports to the U. K.
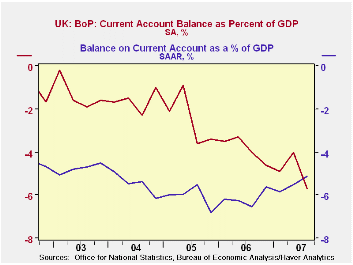
In hindsight, the earlier rise in the value of the pound appears to have been somewhat anomalous. The British current account as a percentage of GDP, which had been relatively high, was even higher than that of the U.S. in the third quarter of last year as can be seen in the third chart.
| GERMAN MANUFACTURING NEW ORDERS AND SALES (2000=100) | Jan 11, 2008 | Nov 11, 2007 | % Chg | ||
|---|---|---|---|---|---|
| Broad Effective Exchange Rates (Jan, 2005=100) | |||||
| U. K . | 95.04 | 102.89 | -7.63 | -- | -- |
| U. S. | 89.63 | 90.13 | 0.56 | -- | -- |
| Pound/ Euro | 1.32 | 1.44 | -8.33 | -- | -- |
| Pound/Dollar | 1.96 | 2.11 | -7.11 | -- | -- |
| Q3 2007 | Q2 2007 | Q3 2006 | Q/Q Dif | Y/Y Dif | |
| Current Account/ GDP (%) | |||||
| U. K . | 5.7 | -4.0 | -4.0 | -1.7 | 0 |
| U. S. | 5.1 | 5.4 | 6.6 | -0.3 | -1.5 |
by Robert Brusca January 14, 2008
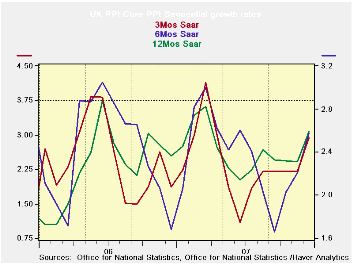
UK Core PPI inflation is making a strong move above the 2%
inflation threshold that the Bank of England applies to overall
consumer inflation (HICP). While the PPI is not the main inflation
metric for the Bank, the surge of inflation at this earlier stage of
production is not welcome news. PPI inflation can be erratic in the UK.
Since Early 2006 this is already the third inflation cycle. Three month
inflation peaked around 3.75% before mid-2006 and again around April
2007; the pace of inflation is again heading higher again in late 2007.
While the successive peaks for inflation were higher during this
episode, the troughs were lower. Through all this, core inflation on a
Yr/Yr basis has been broadly steady. But after edging lower through
November, Yr/Yr core inflation has tuned higher in December. Although
such a move makes a BOE rate cut less likely, the surge in the PPI came
as sterling was hitting a new low vs the euro, the weakest since Dec
1996. Britain, the Euro Area and US all have Central Banks facing tough
policy choices.
| UK PPI | |||||||
|---|---|---|---|---|---|---|---|
| % M/M | %-SAAR | ||||||
| Dec-07 | Nov-07 | Oct-07 | 3-Mo | 6-Mo | 12-MO | 12-Mo Y-Ago | |
| MFG | 0.8% | 0.8% | 0.7% | 9.5% | 5.8% | 5.0% | 2.2% |
| Core | 0.4% | 0.2% | 0.2% | 2.9% | 2.6% | 2.6% | 2.4% |
| Core: ex food beverages, tobacco & Petroleum | |||||||
by Robert Brusca January 14, 2008
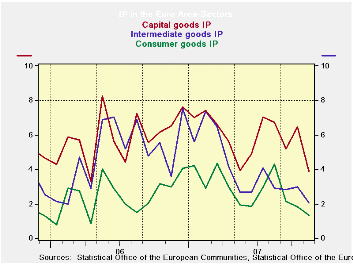
Industrial output is dropping in November and more than
offsetting the rise in October that followed another drop in September.
The chart shows that while industrial output trends are ragged across
sectors they are also losing momentum. Main EMU sectors are lower in
November and in the quarter-to-date (see table, final column). Still
for two of the three largest Euro Area countries, France and Germany,
IP was still advancing in Q2 even though it did fall in both those
countries in November. Spain’s sharp rise is no surprise since the
Spanish data are extremely volatile. The UK, an European Union member,
shows a slight drop in output in November and small decline two months
into the fourth quarter as well.
On Balance, the talk for Euro Area suggests that growth is not
the main worry there, while inflation is becoming more of a worry,
unlike the US cycle. Recent reports show that the 3-Month LIBOR premium
over the US discount rate has been evaporating as the successive TAF
auctions have been completed. So Europe may have less of a sense of
risk form the financial crisis that welled up related to sub-prime
loans and more at the end of last year. Still that is different from
saying that growth prospects there have improved. This morning the Euro
was strong and headed toward a new high vs dollar. It made a new high
vs sterling. Surely with the impact for such shifts in the pipeline
growth in the E-zone will not be enhanced. Nonetheless more of the ECB
members seem to be leaning toward agreeing that it is time to hike
rates.
| E-zone and UK IP and MFG | |||||||
|---|---|---|---|---|---|---|---|
| Saar except m/m | Mo/Mo | Nov-07 | Nov-07 | Nov-07 | |||
| Ezone Detail | Nov-07 | Oct-07 | Sep-07 | 3-Mo | 6-mo | 12-mo | Q-2-Date |
| Manufacturing | -0.6% | 0.5% | -1.3% | -5.4% | 1.0% | 2.2% | -1.3% |
| Consumer Goods | -0.2% | 0.2% | -1.4% | -5.6% | 0.1% | 1.3% | -1.8% |
| Consumer Durables | -1.9% | 0.0% | -3.7% | -20.5% | -4.5% | -3.1% | -- |
| Consumer Nondurables | 0.1% | 0.1% | -1.2% | -4.1% | 0.8% | 2.2% | -- |
| Intermediate Goods | -0.6% | 0.6% | -1.4% | -5.8% | 0.6% | 2.1% | -1.5% |
| Capital Goods | -0.7% | 0.9% | -1.3% | -4.1% | 4.0% | 3.9% | 0.7% |
| Main E-zone Countries and UK IP in MFG | |||||||
| Mo/Mo | 104.8 | 104.8 | 104.8 | ||||
| Memo: Manufacturing | 1-Mo% | 1-Mo% | 1-Mo% | 3-Mo | 6-mo | 12-mo | Q-2-Date |
| Germany | -0.9% | 0.2% | -0.1% | -2.9% | 2.7% | 4.5% | 2.0% |
| France: IP excl Construction | -1.5% | 2.1% | -1.3% | -3.0% | 0.8% | 2.5% | 2.5% |
| Italy | -1.4% | -0.6% | -1.7% | -13.9% | -5.3% | -3.9% | -9.3% |
| Spain | -6.2% | 10.2% | -6.8% | -13.6% | -7.7% | -0.7% | 13.2% |
| UK | -0.1% | 0.3% | -0.7% | -1.9% | -0.2% | 0.1% | -0.2% |

Tom Moeller
AuthorMore in Author Profile »Prior to joining Haver Analytics in 2000, Mr. Moeller worked as the Economist at Chancellor Capital Management from 1985 to 1999. There, he developed comprehensive economic forecasts and interpreted economic data for equity and fixed income portfolio managers. Also at Chancellor, Mr. Moeller worked as an equity analyst and was responsible for researching and rating companies in the economically sensitive automobile and housing industries for investment in Chancellor’s equity portfolio. Prior to joining Chancellor, Mr. Moeller was an Economist at Citibank from 1979 to 1984. He also analyzed pricing behavior in the metals industry for the Council on Wage and Price Stability in Washington, D.C. In 1999, Mr. Moeller received the award for most accurate forecast from the Forecasters' Club of New York. From 1990 to 1992 he was President of the New York Association for Business Economists. Mr. Moeller earned an M.B.A. in Finance from Fordham University, where he graduated in 1987. He holds a Bachelor of Arts in Economics from George Washington University.
More Economy in Brief


