 Global| Feb 19 2008
U.S. Budget Deficit Deeper: A Weaker Economy
by:Tom Moeller
|in:Economy in Brief
Summary
The U.S. government ran a budget surplus last month of $17.8B. The news did not, however, represent real improvement in the government's budget condition. The surplus shrank and was roughly half that during January of 2007 when a [...]
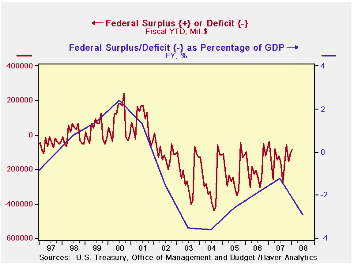
The U.S. government ran a budget surplus last month of $17.8B. The news did not, however, represent real improvement in the government's budget condition. The surplus shrank and was roughly half that during January of 2007 when a surplus of $38.2B. Typically a surplus is run during the month of January.
The shrinkage of the January surplus highlights a worsening of the budget condition. For the first four months of FY08 the government's budget deficit of $87.7B was roughly double the $42.2B during the first four months of FY07. The deterioration in the dollar value of the deficit highlights the projected deterioration as a percentage of the nominal value of GDP.
For the fiscal year to date, growth in federal receipts slowed
to 3.3% which was one third the growth during the first four months of
FY07. The weaker economy with its slower employment growth brought
slower growth in individual income tax receipts (44% of total
receipts); to 4.2% from 12.6%. Withheld income taxes grew 4.4%, a sharp
slowdown from 11.2% last fiscal year, but the weaker stock market
brought a more dramatic drop in the growth in non-withheld taxes; to
4.8% from 21.9% during the four months of FY07.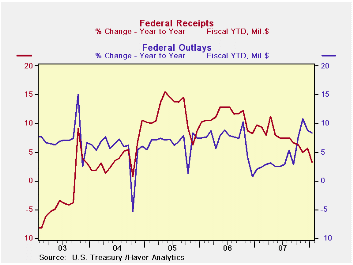
Corporate income taxes (13% of total receipts) fell 2.5% as a result of the weakness in corporate profits. During FY07 they rose 16.4% during the first four months. Growth in employment & general retirement contributions actually rose slightly to 5.8% from 4.0% but unemployment insurance receipts fell 6.0%, nearly twice the rate of decline in early FY07.
U.S. net outlays grew 8.3%, well up from FY07 but steady with prior years. Growth in defense spending (19% of total outlays) of 9.6% was roughly steady and Medicare expenditures (12% of outlays) fell 3.0%. Growth in social security spending (21% of outlays) held about steady at 5.7% but interest expense grew 20.3% with the rise in interest rates.
The Government's financial data is available in Haver's USECON database.
The Federal Reserve's Tools for Responding to Financial Disruptions is Friday's speech made by Federal Reserve Board Governor Frederic S. Mishkin and it can be found here .
| US Government Finance | January | December | Y/Y | FY 2007 | FY 2006 | FY 2005 |
|---|---|---|---|---|---|---|
| Budget Balance | $17.839B | $48.261B | $38.236B (1/07) |
-$162.8B | -$248.2B | -$318.7B |
| Net Revenues | $255.2B | $277.0B | -2.1% | 6.7% | 11.8% | 14.1% |
| Net Outlays | $237.4B | $228.7B | 6.7% | 2.8% | 7.4% | 7.6% |
by Louise Curley February 19, 2008
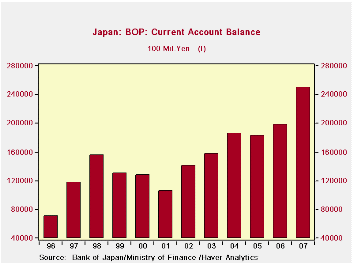
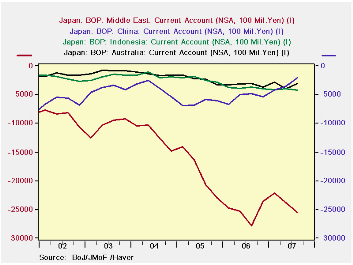
Japan reported a record current account surplus of 250,012 100 million yen or about $215 billion for the year 2007 about a week ago. The current account balance for the past 12 years is shown in the first chart.
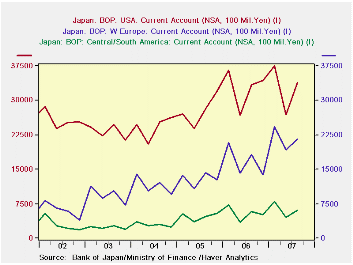
Today Japan reported the breakdown of the current account surplus by region for the third quarter of the year. Japan continues to run its largest surplus on current account with the United States, however, it's surplus with Western Europe appears to be growing faster than that of the U.S. as can be seen in the second chart. This chart also shows Japan's current account surplus with Central/South America, which shows a small upward trend.
Japan has traditionally run a deficit with China, Indonesia and the Middle East. The deficits with the Indonesia and the Middle East are largely the as a result of Japan's dependence on imported oil. These deficits have increased sharply with the rise in the price of oil. The deficit with China, however, has decreased significantly this year as can be seen in the third chart.
| JAPAN CURRENT ACCOUNT BY REGION (100 billion yen) | Q4 07 | Q3 07 | Q2 07 | Q1 07 | 2007 | 2006 | 2005 | 2004 |
|---|---|---|---|---|---|---|---|---|
| Total | 57.6 | 68.6 | 56.0 | 68.3 | 250.0 | 198.5 | 182.6 | 186.2 |
| United States | n.a. | 33. | 26.9 | 37.4 | n.a. | 130.8 | 111.2 | 96.9 |
| Western Europe | n.a. | 21.6 | 19.4 | 24.3 | n.a. | 66.9 | 51.6 | 46.0 |
| Central/South America | n.a. | 6.1 | 4.5 | 8.0 | n.a. | 21.8 | 19.1 | 11.8 |
| China | n.a. | -2.0 | -3.5 | -4.2 | n.a. | -22.0 | -25.6 | -14.9 |
| Indonesia | n.a. | -4.3 | -4.0 | -4.1 | n.a. | -15.2 | -9.1 | -6.7 |
| Middle East | n.a. | -25.5 | -23.8 | -22.1 | n.a. | -101.5 | -74.1 | -48.1 |
by Robert Brusca February 19, 2008
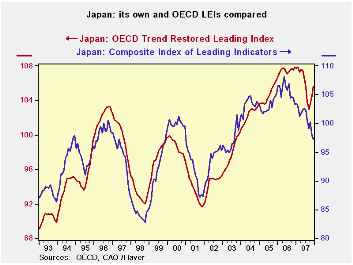
Japan’s own leading index composite is demonstrating ongoing weakness. The OECD’s take is that there is an improvement afoot. Japan’s own index peaked in the first half of 2006 and has since then been in a steady and rapid deteriorating phase. Not so for the OECD measure. It went flat from early 2006 to early 2007 then fell sharply but has since regained about half of its drop. These are two different views of Japan’s future to be sure – as well as different views of its present.
While the two indexes broadly tell the same story historically, currently their divergence has never been so great. The OECD index is a bit smoother back through time. There have been disagreements in the message of these two indexes before, but never one so stark with one index rising while the other is falling. In the past they were not directionally different as much as one simply lagged the other.
Recently it seems that the OECD index has performed a bit better. In 2000 it turned over to show weakness first. From 2001 to 2005 it expanded steadily while Japan’s own index moved up to dwell at two separate plateaus before expanding again. It is hard to argue with the OECD’s recent plateauing then dropping as being a superior signal to the Japan’s domestic LEI that has simply fallen so sharply that it would be reasonable to look for even more disruption in the economy. But then maybe that bad news is still in the pipeline?
On the other hand what rings false about the OECD index is
that,
apart from the recent episode of plateauing then dropping, it has the
index at its highest point in 15 years. The Japan’s domestic LEI has
the index level back below four past peaks going back to 1994. Those
are real differences, not just different assessments on the timing of
the economic rebound.
We are left in a quandary by these discrepancies. Still it is clear that both reports are saying that Japan has taken some hit and the uncertainty is about how soon or vigorous the recovery will be. But they are also saying that there is some difference of opinion on how hard Japan has been hit and that is an important element in assessing the depth of the expected drop as well as the timing of recovery. As a result we must be prepared to continue to watch Japan closely.
| Japan's LEI and its Trends | |||||||
|---|---|---|---|---|---|---|---|
| Levels | Growth (saar) | ||||||
| Dec-07 | Nov-07 | Oct-07 | 3M0 | 6M0 | 12Mo | 24MO | |
| LEI | 97.3 | 97.8 | 100.3 | -7.1% | -10.1% | -5.8% | -7.6% |
| LEI: OECD | 105.7 | 104.6 | 103.5 | 11.0% | -1.9% | -2.0% | -0.7% |
| OECD LEI Details | |||||||
| Share P | 1.2 | 1.2 | 1.3 | -12.7% | -27.0% | -8.2% | -6.1% |
| Int Spread (chngs) | -0.5 | -0.5 | -0.4 | -0.2 | -0.5 | -0.4 | -0.7 |
| Loan/Deposit | #N/A | 1.1 | 1.1 | -1.1% | 1.5% | 1.2% | 7.1% |
| Dwellings Started | 0.9 | 0.9 | 0.8 | 319.1% | -39.9% | -18.4% | -8.8% |
| OT-MFG | #N/A | 1.0 | 1.0 | 8.5% | 6.3% | 0.0% | -2.0% |
| Stocks/Deliv (M&M) | #N/A | 1.0 | 1.0 | 10.6% | 6.6% | 1.3% | 2.1% |
| Exp>Imp | -0.1 | -0.1 | -0.1 | -40.9% | 93.6% | -214.3% | -900.0% |
| SmallBiz | #N/A | #N/A | #N/A | 7.1% | -6.4% | -8.1% | -5.2% |
| Grey shaded rows are one month behind current; Small Biz lags by SIX months | |||||||

Tom Moeller
AuthorMore in Author Profile »Prior to joining Haver Analytics in 2000, Mr. Moeller worked as the Economist at Chancellor Capital Management from 1985 to 1999. There, he developed comprehensive economic forecasts and interpreted economic data for equity and fixed income portfolio managers. Also at Chancellor, Mr. Moeller worked as an equity analyst and was responsible for researching and rating companies in the economically sensitive automobile and housing industries for investment in Chancellor’s equity portfolio. Prior to joining Chancellor, Mr. Moeller was an Economist at Citibank from 1979 to 1984. He also analyzed pricing behavior in the metals industry for the Council on Wage and Price Stability in Washington, D.C. In 1999, Mr. Moeller received the award for most accurate forecast from the Forecasters' Club of New York. From 1990 to 1992 he was President of the New York Association for Business Economists. Mr. Moeller earned an M.B.A. in Finance from Fordham University, where he graduated in 1987. He holds a Bachelor of Arts in Economics from George Washington University.
More Economy in Brief


