 Global| Sep 04 2008
U.S. August Light Vehicle Sales Recovered Modestly
by:Tom Moeller
|in:Economy in Brief
Summary
U.S. sales of light vehicles in August recovered their decline during July and rose 9.3%, according to the Autodata Corporation. The latest sales level of 13.72M units, nevertheless, left sales for the year so far averaging 14.32M. [...]
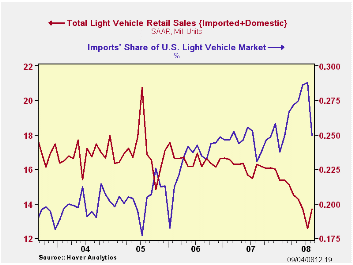
U.S. sales of light vehicles in August recovered their decline during July and rose 9.3%, according to the Autodata Corporation. The latest sales level of 13.72M units, nevertheless, left sales for the year so far averaging 14.32M. That's down 11.6% from the 16.20M averaged during the first eight months of last year. The level of August vehicle sales was higher than Consensus expectations for sales of 13.0M.
Sales of domestically made light vehicles recovered the declines of the prior two months. They rose 15.2% to 10.30M. Nevertheless, sales remained down 13.7% YTD.
Aggressive discounting lifted sales of domestically made light
trucks to their highest level since March. The 28.1% jump from July
still left sales down 20.2% YTD.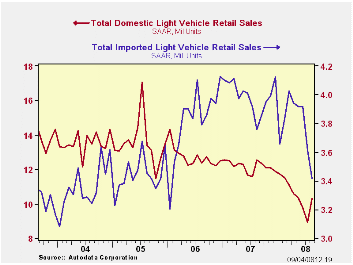
Sales of U.S. made cars rose just 1.5% after two months of sharp decline. Nevertheless and continuing drivers' shift to purchases of relatively fuel efficient vehicles, car sales were down only 4.5% YTD.
Sales of imported light vehicles showed further the effect of weakness in consumer spending on durable goods. They fell by 5.3% to 3.42 million units which was their lowest level since early 2006.
Sales of imported autos repeated their July drop and declined by 8.4% to 2.33M units. Year-to-date sales, however, were flat with the first eight months of 2007.
Imported light truck sales ticked up just 1.8% (-22.0% y/y) after four months of sharp decline. They too have felt the effect of higher fuel costs and were down 14.2% YTD.
Import's share of the U.S. light vehicle market fell to 24.9%, the lowest since this past February. (Imported vehicles are those produced outside the U.S. and does not include vehicles with the nameplate of a foreign manufacturer produced within the U.S.).
| Light Vehicle Sales (SAAR, Mil. Units) | August | July | Y/Y | 2007 | 2006 | 2005 |
|---|---|---|---|---|---|---|
| Total | 13.72 | 12.55 | -15.8% | 16.17 | 16.54 | 16.96 |
| Autos | 6.74 | 6.88 | -9.1 | 7.58 | 7.77 | 7.65 |
| Domestic | 4.41 | 4.35 | -12.7 | 5.07 | 5.31 | 5.40 |
| Imported | 2.33 | 2.54 | -1.4 | 2.51 | 2.45 | 2.25 |
| Light Trucks | 6.98 | 5.67 | -21.5 | 8.60 | 8.78 | 9.32 |
| Domestic | 5.89 | 4.59 | -21.4 | 7.12 | 7.42 | 8.12 |
| Imported | 1.09 | 1.07 | -22.0 | 1.48 | 1.37 | 1.20 |
by Tom Moeller September 4, 2008
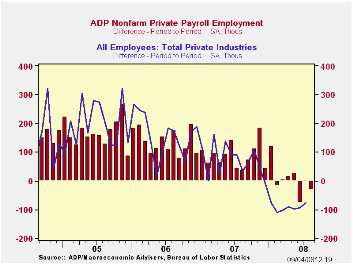
The ADP National Employment Report, from the payroll processor, indicated that August private nonfarm payrolls fell 33,000 after a downwardly revised uptick of 1,000 during July. The decline about matched expectations for an August drop of 30,000.
The U.S. Bureau of Labor Statistics will report on August payroll employment tomorrow. Last month, the 1,000 worker rise in ADP's measure of private nonfarm payrolls was accompanied by a 76,000 worker decline in the BLS measure of private sector payrolls.
According to ADP and Macro Advisers, the correlation between the monthly percentage change in the ADP estimate and that in the BLS data is 0.90.
Goods producing payrolls fell by 78,000 (-2.6% y/y) and the monthly declines were spread fairly evenly between large (-4.6% y/y), medium (-2.8% y/y) and small (-1.3% y/y) payrolls.
Employment in the service producing industry rose by 45,000 (1.1% y/y). Small payrolls rose 36,000 (1.6% y/y) while medium sized payrolls inched up 8,000 (1.1% y/y). Large service producing payrolls ticked up by an even smaller 1,000 (-0.3% y/y).
ADP compiled the estimate from its database of individual companies' payroll information. Macroeconomic Advisers, LLC, the St. Louis economic consulting firm, developed the methodology for transforming the raw data into an economic indicator.
The ADP National Employment Report data is maintained in Haver's
USECONdatabase; historical data go back to December 2000. The figures in this report cover only private sector jobs and exclude employment in the public sector, which rose an average 11,083 during the last twelve months.>
The full ADP National Employment Report can be found here, and the ADP methodology is explained here.
The Fed's latest Beige Book can be found here.
| LAXEPA@USECON | August | July | Y/Y | 2007 | 2006 | 2005 |
|---|---|---|---|---|---|---|
| Nonfarm Private Payroll Employment (m/m Chg.) | -33,000 | 1,000 | 0.4% | 1.1% | 1.7% | 1.8% |
by Tom Moeller September 4, 2008
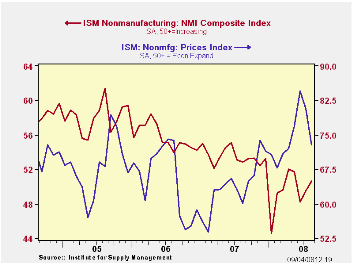
The Composite Index for the nonmanufacturing sector, from the Institute for Supply Management, again ticked up. For August it rose to 50.6 from an unrevised 49.5 during July. The latest was the highest level since May. Consensus expectations had been for a slightly lower August reading of 49.5.
Beginning with the January 2008 Nnonmanufacturing Report
On Business®, a composite index is now calculated as an
indicator of the overall economic condition for the nonmanufacturing
sector. It is a composite index based on the diffusion indexes for four
of the indicators (business activity, new orders, employment and
supplier deliveries) with equal weights. The latest report from the ISM
can be found here.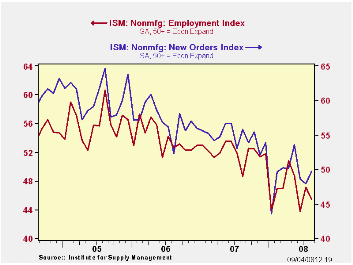
The nonmanufacturing business activity sub-index rose to 51.6 from 49.6 in July and the latest level equaled the 2Q average. Since the series' inception in 1997 there has been a 48% correlation between the level of the business activity index for the nonmanufacturing sector and the Q/Q change in real GDP for the services and the construction sectors.
The new orders sub-index also made up the prior month's decline and rose to 49.7, the highest level since May.
The employment index, conversely, fell m/m to 45.4 and reversed half of its July improvement. Since the series' inception in 1997 there has been a 56% correlation between the level of the ISM nonmanufacturing employment index and the m/m change in payroll employment in the service-producing plus the construction industries.
Pricing power fell sharply to 72.9 which was its lowest level since May. Since inception ten years ago, there has been a 60% correlation between the price index and the q/q change in the GDP services chain price index.
ISM surveys more than 370 purchasing managers in more than 62 industries including construction, law firms, hospitals, government and retailers. The nonmanufacturing survey dates back to July 1997.
| ISM Nonmanufacturing Survey | August | July | August '07 | 2007 | 2006 | 2005 |
|---|---|---|---|---|---|---|
| Composite Index | 50.6 | 49.5 | 52.8 | 53.5 | 55.7 | 58.0 |
| Prices Index | 72.9 | 80.8 | 60.1 | 63.8 | 65.3 | 68.0 |
by Tom Moeller September 4, 2008
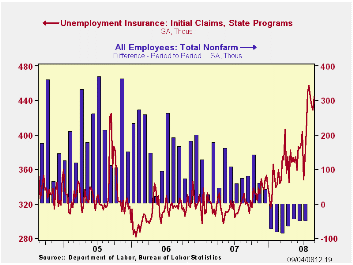
Initial claims for unemployment insurance rose unexpectedly last week to 444,000 from 429,000 during the prior week. The latest level was the highest in four weeks.
The four-week moving average dipped again w/w to 438,000 (34.7% y/y), still the highest level since near the end of the 2001 recession 2001. During July claims averaged 393,000.
A program to locate people eligible for jobless benefits may
have continued to play a role in last week's elevated level of claims.
Congress approved the extra benefits in June.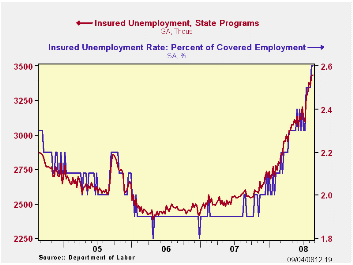
A claims level below 400,000 typically has been associated with growth in nonfarm payrolls. During the last ten years there has been a (negative) 76% correlation between the level of initial claims and the m/m change in nonfarm payroll employment. Over the longer period of time, the level of claims for jobless insurance has not trended higher with the size of the labor force due to a higher proportion of self-employed workers who are not eligible for benefits.
Continuing claims for unemployment insurance during the latest week ticked up another 6,000 after an upwardly revised 70,000 jump during the prior week. The four-week moving average of continuing claims rose to 3,400,250, the highest level since late-2003.
Continuing claims provide some indication of workers' ability to find employment and they lag the initial claims figures by one week.
The insured rate of unemployment was stable at 2.6%, the highest level since late-2003.
| Unemployment Insurance (000s) | 08/30/08 | 08/23/08 | Y/Y | 2007 | 2006 | 2005 |
|---|---|---|---|---|---|---|
| Initial Claims | 444 | 429 | 38.7% | 322 | 313 | 331 |
| Continuing Claims | -- | 3,435 | 32.7% | 2,552 | 2,459 | 2,662 |
by Tom Moeller September 4, 2008
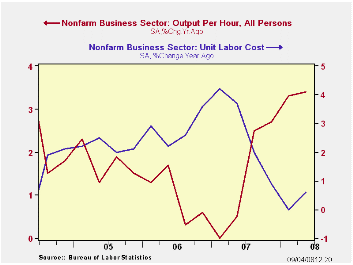
Labor productivity in the nonfarm business sector rose a revised 4.3% last quarter. The increase was larger than expected growth of 3.4% and it was double the preliminary estimate of a 2.2% increase.
The upward revision was due to a near-doubling of output growth to 3.4% and a slightly larger 0.8% decline in hours worked.
Growth in compensation per hour was little-changed at 3.7% and that about equaled the 1Q increase.
Unit labor cost growth was revised to show a slight 0.5% decline rather than the 1.3% increase estimated earlier. Year-to-year that left costs up just 0.6% from one year earlier.
In the factory sector productivity growth was revised down and it showed a 2.2% decline (+2.4% y/y). Productivity rose 3.4% last year. Unit labor cost growth surged a little-revised 6.2% (1.4% y/y) as compensation rose 3.9% (3.8% y/y).
In the nonfinancial corporate sector, productivity surged 5.6% and the y/y gain rose to 2.3% after a 1.9% increase last year.Compensation in the corporate sector rose 3.7% (3.8% y/y), a gain which left unit labor costs to decline 1.8% (+1.5% y/y).
| Nonfarm Business Sector (SAAR, %) | 2Q '08 | 1Q '08 | Y/Y | 2007 | 2006 | 2005 |
|---|---|---|---|---|---|---|
| Output per Hour | 4.3 | 2.6 | 3.4 | 1.4 | 1.0 | 1.8 |
| Compensation per Hour | 3.7 | 3.8 | 4.0 | 4.1 | 3.8 | 4.0 |
| Unit Labor Costs | -0.5 | 1.2 | 0.6 | 2.7 | 2.8 | 2.2 |
by Robert Brusca September 4, 2008
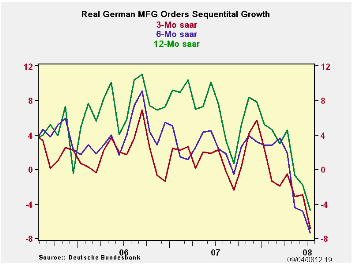
German orders are clearly falling. Orders are dropping from domestic sources as well as from foreign sources. The degree of decline is accelerating both domestically and from overseas; the degree of the drop is substantial.
The new quarter is quite new, but one month into it, the degree of decline is severe for orders and sales.
Orders are weak enough and have been weak enough for long enough that real sales are starting to show adverse trends. Over three months all major sales categories are showing significant volume declines.
In comment today Nout Wellink of the Dutch central bank warned that the credit crisis would linger for several years. European Economic and Monetary Affairs Commissioner Joaquin Almunia said that, "We're experiencing a serious economic downturn…’ he attributes the slip to several causes but adds that fears of recession are exaggerated. Still, the notion of recession is haunting Europe as it has haunted the US. Former BOE governor Eddie George said, "My impression is that most forecasters now expect little growth if any at all across the industrial world as a whole over the next year or so ahead, and certainly technical recession cannot be ruled out."
In Germany there seem to be a difference of opinion on the subject. Up until now most pronouncements have been upbeat hold-the-line sort of things. But yesterday, Deputy Economy Minister Walther Otremba said in an interview that, "Economic indicators and surveys are clearly pointing down and we must expect a slump." He added, "The crisis won't be over quickly; whether or not things will pick up next year is doubtful." Still, yesterday German Finance Minister Peer Steinbrueck also said, "It is completely irresponsible for some pessimists to proclaim, on the basis of just one single quarter of slightly negative growth, that the specter of recession is looming,"
Europe’s data are weak enough to talk of slumps and recessions; the talk is not all on the back of one quarter of declining GDP. Europe’s policymakers (at least the ones in office) do not want to entertain that notion, however. That reluctance suggests either that they are unrealistic or plan to do nothing to avert the growing weakness.
| German Orders and Sales By Sector and Origin | ||||||||
|---|---|---|---|---|---|---|---|---|
| Real and SA | % M/M | % Saar | ||||||
| Jul-08 | Jun-08 | May-08 | 3-MO | 6-Mo | 12-Mo | YrAgo | QTR-2-Date | |
| Total Orders | -1.7% | -2.6% | -1.3% | -20.0% | -10.6% | -4.1% | 7.2% | -20.7% |
| Foreign | 0.3% | -4.5% | 0.1% | -15.3% | -8.0% | -3.4% | 7.0% | -15.2% |
| Domestic | -3.6% | -0.5% | -2.9% | -24.7% | -13.2% | -4.8% | 7.5% | -25.8% |
| Real Sector Sales | ||||||||
| MFG/Mining | -2.3% | -0.2% | -0.7% | -12.2% | -6.3% | -0.7% | 5.8% | -15.0% |
| Consumer | -0.4% | -1.4% | -0.1% | -7.2% | -3.7% | -2.5% | 1.6% | -7.8% |
| Consumer Durables | -3.4% | 1.7% | -3.2% | -18.1% | -9.5% | -4.7% | 2.9% | -18.6% |
| Consumer Nondurables | 0.2% | -1.9% | 0.6% | -4.6% | -2.3% | -2.1% | 1.4% | -5.3% |
| Capital Goods | -4.4% | 0.9% | -2.5% | -21.9% | -11.6% | -1.0% | 7.8% | -24.9% |
| Intermediate Gds | -1.0% | -1.0% | 1.5% | -2.3% | -1.1% | 0.4% | 6.4% | -6.9% |
| All MFG-Sales | -2.1% | -0.3% | -0.7% | -12.1% | -6.3% | -0.8% | 5.5% | -14.6% |

Tom Moeller
AuthorMore in Author Profile »Prior to joining Haver Analytics in 2000, Mr. Moeller worked as the Economist at Chancellor Capital Management from 1985 to 1999. There, he developed comprehensive economic forecasts and interpreted economic data for equity and fixed income portfolio managers. Also at Chancellor, Mr. Moeller worked as an equity analyst and was responsible for researching and rating companies in the economically sensitive automobile and housing industries for investment in Chancellor’s equity portfolio. Prior to joining Chancellor, Mr. Moeller was an Economist at Citibank from 1979 to 1984. He also analyzed pricing behavior in the metals industry for the Council on Wage and Price Stability in Washington, D.C. In 1999, Mr. Moeller received the award for most accurate forecast from the Forecasters' Club of New York. From 1990 to 1992 he was President of the New York Association for Business Economists. Mr. Moeller earned an M.B.A. in Finance from Fordham University, where he graduated in 1987. He holds a Bachelor of Arts in Economics from George Washington University.
More Economy in Brief


