 Global| May 05 2008
U.S. April ISM Non-Manufacturing Index Improved, Trend Still Lower
by:Tom Moeller
|in:Economy in Brief
Summary
For April, the Institute for Supply Management reported that its Composite Index for the non-manufacturing sector improved further. At 52.0, the index was up from 49.6 in March and it was well up from the recent low of 44.6 in [...]
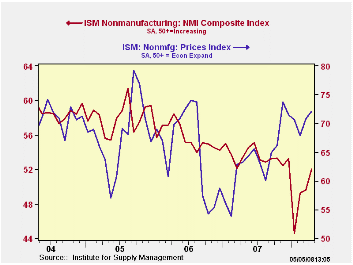
For April, the Institute for Supply Management reported that its Composite Index for the non-manufacturing sector improved further. At 52.0, the index was up from 49.6 in March and it was well up from the recent low of 44.6 in January. Consensus expectations had been for a lower April reading of 49.1.
The trend in the index, however, remained under pressure. For the first four months of 2008 the index averaged 48.9. A level of 50 is the break even point between rising and falling activity in the service sector.
Beginning with the January 2008 Non-Manufacturing Report On Business®, a composite index is now calculated as an indicator of the overall economic condition for the non-manufacturing sector. It is a composite index based on the diffusion indexes for four of the indicators (business activity, new orders, employment and supplier deliveries) with equal weights. The latest report from the ISM can be found here.
The non-manufacturing business activity sub-index fell
somewhat to 50.9 from 52.2 in March. So far in 2008 the index has
averaged 48.9, down from 56.0 during all of last year. Since the
series' inception in 1997 there has been a 48% correlation between the
level of the business activity index for the non-manufacturing sector
and the Q/Q change in real GDP for the services and the construction
sectors. The correlation of the separate factory sector ISM index with
the change in real GDP less just services is a higher 57%.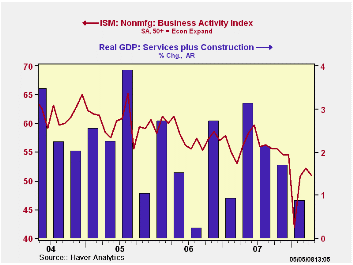
The new orders sub-index held about steady with March at 50.1 and the four month figure averaged 48.4 versus 54.8 last year. The supplier delivery index improved quite sharply last month to a reading of 56.0 from 49.0 in March. So far this year, however, the index still was steady with 2007 at 51.0.
The employment index also improved m/m to 50.8 from 46.9 in March. That was not enough, however, to lift the year to date average, at 47.1, above break even. The series remained below last year's level of 52.0. Since the series' inception in 1997 there has been a 56% correlation between the level of the ISM non-manufacturing employment index and the m/m change in payroll employment in the service producing plus the construction industries.
Pricing power continued firm. The prices paid index at 72.1 rose 1.3 points from March and added to that month's 2.9 point gain. The latest was the highest level since last November and it was well up from the 2007 average of 63.8. Since inception ten years ago, there has been a 60% correlation between the price index and the q/q change in the GDP services chain price index.
ISM surveys more than 370 purchasing managers in more than 62 industries including construction, law firms, hospitals, government and retailers. The non-manufacturing survey dates back to July 1997.
| ISM Nonmanufacturing Survey | April | March | April '07 | 2007 | 2006 | 2005 |
|---|---|---|---|---|---|---|
| Composite Index | 52.0 | 49.6 | 53.4 | 53.5 | 55.7 | 58.0 |
| Prices Index | 72.1 | 70.8 | 63.2 | 63.8 | 65.3 | 68.0 |
by Louise Curley May 5, 2008
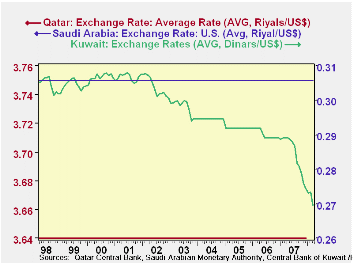
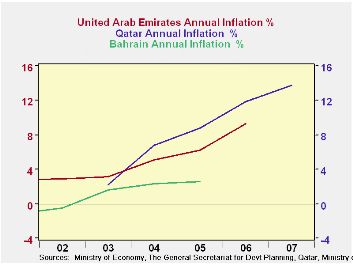
The Gulf States, Bahrain, Kuwait, Oman, Qatar, United Arab Emirates and Saudi Arabia have, with the exception of Kuwait, long kept their exchange rates pegged to the dollar. The first chart shows the exchange rates of Qatar and Saudi Arabia as typical of the majority of the Gulf States and that of Kuwait that has been slowly appreciating since early 2002.
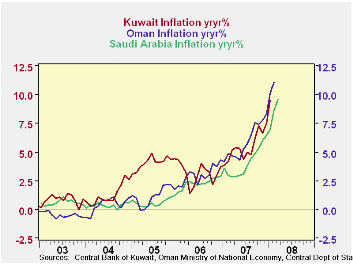
As inflation has increased with the rise in oil wealth in all the states, talk of appreciation of the currencies of the other five gulf states has become widespread. The second chart shows monthly inflation rates in Kuwait, Oman and Saudi Arabia. These are the only states that have monthly data. The remaining states have only quarterly or annual data. The annual rates of inflation for these states are shown in the third chart. The latest data for Bahrain is 2.59% in 2005, for Qatar 9.29% in 2006 and 13.76% for the United Arab Emirates in 2007.
| GULF STATES | Mar 08 | Feb 08 | Jan 08 | Mar 07 | Feb 07 | Jan 08 | 2007 | 2006 | 2005 |
|---|---|---|---|---|---|---|---|---|---|
| Inflation | |||||||||
| Saudi Arabia | 9.60 | 8.67 | 6.95 | 2.86 | 2.98 | 3.87 | 4.12 | 2.30 | 0.61 |
| Oman | -- | 11.11 | 10.12 | -- | 4.58 | 4.16 | 5.94 | 3.04 | 1.19 |
| Kuwait | -- | -- | 9.53 | -- | -- | 3.87 | 5.48 | 3.10 | 4.09 |
| Exchange Rates | Recent Quote | ||||||||
| Bahrain Dinar/USD | .376 | ||||||||
| Kuwait Dinar/USD | .266 | ||||||||
| Oman Rial/USD | .385 | ||||||||
| Qatar Riyal/USD | 3.64 | ||||||||
| United Arab Emirates Dirham/USD | 3.68 | ||||||||
| Saudi Arabia Riyal/USD | 3.75 |
by Robert Brusca May 5, 2008
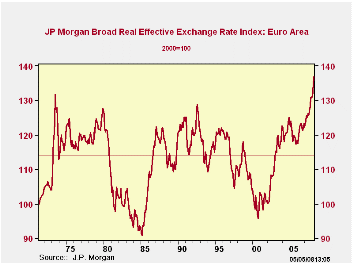
In recognition of ‘cinco de mayo’ we say ‘MUY FUERTE’ (or very strong) - The chart above displays the JP Morgan broad trade-weighted index value of the euro. In this framework we convert the index to operate as a PPP index, or index of purchasing power parity by inserting a line representing its mean value from 1972 onward, after the period of fixed rates ended. Enabled by the assumption that FX markets are reasonably competitive and despite sometimes heavy handed intervention by monetary authorities (especially those that have accumulated large FX reserve balances, thereby thwarting the market mechanism of making the private sector absorb flows or force changes in FX rates when there are imbalances) we appeal to the market mechanism as being one that gets the level of the exchange rate right over the long haul. The period above spans 1972 to 2008. Thus we set the mean of the real weighted dollar index for this period to parity (it lies at 113.8 on the scale) and plot the series. What you get is the chart you see above. As a result the value of 113.8 is the market’s estimate of parity. Above the value of 100 the euro is too high, below it, it is too weak. Right now the euro is too high by some 20%. The highest overvaluation in the period since fixed rate were abolished.
This PPP chart of course plots a ‘euro;’ that did not exist before 1990. To plug that gap a weighting process is used to reconstruct the index for the same group of countries that are in the euro today. Since the European currencies have, for much of this episode, been tethered together in an arrangement called ‘the snake’ (or the snake in a tunnel). I think this treatment is useful for historic comparison.
A similar formulation of the dollar shows that it is undervalued by about 15% on broad currency weighted basis. From that we see that euro seems to have more disequilibrium to deal with on the upside than the dollar does on the downside. And while European data are not uniform in their signals there are some strong hints by local economists, business groups and labor groups and there has been a lot of policymaker squawking to make us think that Europe is indeed suffering from this overvaluation. The data on trade trends are a useful diagnostic.
EU trade is showing the wear and tear of a rising exchange rate. The twelve month growth rates show that European exports are generally decelerating. Among these groups, exports in 2007 decelerated compared to 2006 growth rates in 75% of the destinations without regard to size. With regard to size some 87% of the exports are slowing. The size-weighted slowing has jumped sharply in 2007. This last move up in the euro of about 9% in one year on a trade weighted basis has made a large impact. EMU trade flows are predominately slowing already and we know that the impact from exchanger rate changes embodies lags.
Economic summits have been poor vehicles achieve macroeconomic change in recent years and so they have turned their attention to global issues and to North-South (developed VS undeveloped country) trade issues and tariff reduction. At the last G-7 summit participants came away giving markets very different views of what was waiting for them on the exchange rate front with European participants talking of a strong commitment to limit the dollar’s drop while US officials pointed to the unchanged nature of the langue of the communiqué.
European MFG and consumer data plus the survey data on activity in the EMU and EU areas seem to confirm that slowing is taking root in Europe. The backing off the euro and the dollar from their respective precipices is welcome news. But the Euro still faces some strong challenges and so does growth in Europe.
| EMU12 Export Trends BY Region 12Mo % | ||||||
|---|---|---|---|---|---|---|
| Dec-07 | Dec-06 | Dec-05 | Dec-04 | Dec-03 | SHARE | |
| EU/NonEMU | 5.1% | 19.2% | 18.7% | 10.1% | 8.3% | 23.4% |
| UK | 0.0% | 7.8% | 7.6% | -8.2% | 6.1% | 16.9% |
| Russia | 10.9% | 29.7% | 19.7% | 31.6% | 11.7% | 5.2% |
| Switzerland | -3.0% | 14.1% | 3.8% | 12.1% | -0.2% | 6.2% |
| Turkey | 5.6% | -5.1% | 35.4% | 12.3% | 22.7% | 3.2% |
| US | -17.4% | 5.6% | 21.3% | 0.0% | -6.1% | 14.0% |
| China | 7.9% | 15.4% | 28.2% | 12.4% | 8.3% | 4.5% |
| Japan | -6.0% | -7.0% | 2.9% | 5.8% | 5.6% | 2.4% |
| Other Asia | -8.0% | -7.5% | 2.8% | 5.4% | 5.6% | 2.4% |
| Africa | 8.8% | 4.1% | 19.2% | 8.1% | 2.6% | 6.5% |
| Latin America | 6.5% | 11.4% | 13.3% | 19.4% | -7.7% | 4.6% |
| Other | -3.9% | 11.3% | 7.2% | 7.0% | 18.7% | 10.8% |
| % Slowing | 75.0% | 58.3% | 41.7% | 33.3% | 33.3% | |
| % slowing weighted | 87.6% | 37.8% | 20.8% | 32.4% | 27.8% | |

Tom Moeller
AuthorMore in Author Profile »Prior to joining Haver Analytics in 2000, Mr. Moeller worked as the Economist at Chancellor Capital Management from 1985 to 1999. There, he developed comprehensive economic forecasts and interpreted economic data for equity and fixed income portfolio managers. Also at Chancellor, Mr. Moeller worked as an equity analyst and was responsible for researching and rating companies in the economically sensitive automobile and housing industries for investment in Chancellor’s equity portfolio. Prior to joining Chancellor, Mr. Moeller was an Economist at Citibank from 1979 to 1984. He also analyzed pricing behavior in the metals industry for the Council on Wage and Price Stability in Washington, D.C. In 1999, Mr. Moeller received the award for most accurate forecast from the Forecasters' Club of New York. From 1990 to 1992 he was President of the New York Association for Business Economists. Mr. Moeller earned an M.B.A. in Finance from Fordham University, where he graduated in 1987. He holds a Bachelor of Arts in Economics from George Washington University.
More Economy in Brief


