 Global| May 28 2008
U.S. April Durable Goods Orders Off Less Than Expected; Rose Excl Transportation
by:Tom Moeller
|in:Economy in Brief
Summary
April new orders for durable manufactured goods dipped 0.5% after slipping a little revised 0.3% during March. Consensus expectations had been for a 1.1% decline in April. Outsized weakness in orders for transportation equipment [...]
April new orders for durable manufactured goods dipped 0.5% after slipping a little revised 0.3% during March. Consensus expectations had been for a 1.1% decline in April.
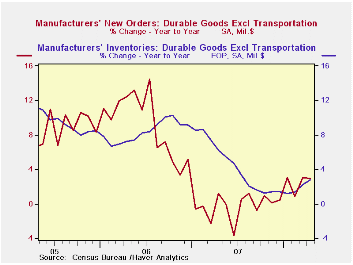
Outsized weakness in orders for transportation equipment accounts for much of this year's weakness in new orders. Overall, orders in the transportation sector this year are down 18.7% led by a 34.1% drop in orders for nondefense aircraft. Orders for motor vehicles & parts also are down 10.6% YTD. Less the transportation sector altogether, durable goods orders actually rose 2.5% last month and have risen 2.1% so far this year.
Orders for nondefense capital goods fell 1.4% during April and
that completely offset a 1.4% March gain. Here again, however, the
latest decline stems from the transportation sector. Less aircraft,
nondefense capital goods orders rose 4.2% in April and that recovered
declines during the prior three months. Since yearend these orders have
risen 1.4%. During the last ten years there has been an 80% correlation
between the y/y gain in nondefense capital goods orders and the rise in
equipment & software spending in the GDP accounts. The
correlation with capital goods shipments is, as one would expect, a
larger 92%.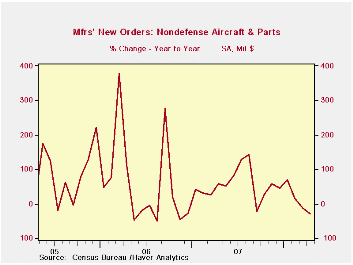
Orders for machinery were strong last month and rose 4.2% (14.5% y/y). Year-to-date machinery orders rose 2.5% after last year's 0.6% uptick.Orders for computers & related products, however, slipped 1.5% and are down 0.5% so far this year. New orders for communications equipment rose 2.2% last month but likewise are down 2.1% in 2008. Also, to the upside were April primary metal orders. They surged 2.8% and are up 6.8% this year.
Overall shipments of durable goods surged 1.2% last month and less the transportation sector shipments also rose a firm 1.3%. Less transportation shipments have risen 1.9% this year after last year's 0.3% uptick.
Inventories of durable goods rose 0.5% during April and year-to-date inventories have increased 2.4% following last year's 3.5% rise. Less transportation, inventories rose 0.4% last month and by 1.7% this year, about the same as during all of 2007.
Has Inventory Volatility Returned? A Look at the Current Cycle from the Federal Reserve Bank of New York can be found here.
| NAICS Classification | April | March | Y/Y | 2007 | 2006 | 2005 |
|---|---|---|---|---|---|---|
| Durable Goods Orders | -0.5% | -0.3% | -3.4% | 1.4% | 6.2% | 10.2% |
| Excluding Transportation | 2.5% | 1.7% | 3.0% | -0.3% | 9.1% | 9.1% |
| Nondefense Capital Goods | -1.4% | 1.4% | -4.8% | 3.5% | 9.4% | 17.3% |
| Excluding Aircraft | 4.2% | -1.0% | 2.4% | -2.7% | 10.7% | 11.6% |
by Tom Moeller May 28, 2008
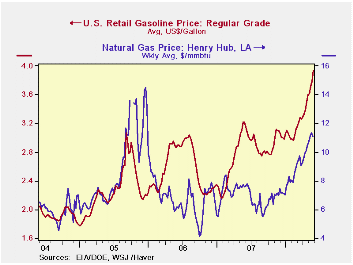
The retail price for a gallon of regular gasoline increased nearly fifteen cents last week to $3.94 per gallon, according to the U.S. Department of Energy survey.So far this year gasoline prices have risen nearly one dollar.
Yesterday, the spot market price for gasoline rose three cents from last week's average to $3.24 per gallon.
During all of last week, the price of a barrel of WTI crude oil rose w/w to an average of $130.15. Yesterday, however, the price slipped back to $128.85. Crude oil prices have roughly doubled from last year's May level.
Natural gas prices dipped slightly last week to $11.08 per mmbtu (46.2% y/y).
Weekly gasoline prices can be found in Haver's WEEKLY database, daily prices are found in the DAILY database.
| Weekly Prices | 05/26/08 | 05/19/08 | Y/Y | 2007 | 2006 | 2005 |
|---|---|---|---|---|---|---|
| Retail Gasoline ($ per Gallon) | 3.94 | 3.79 | 22.7% | 2.80 | 2.57 | 2.27 |
| Light Sweet Crude Oil, WTI ($ per bbl.) | 130.15 | 124.94 | 100.4% | 72.25 | 66.12 | 56.60 |
by Tom Moeller May 28, 2008
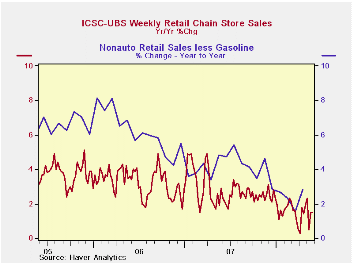
The International Council of Shopping Centers reported that chain store sales were unchanged last week after declines during four of the prior five weeks.
So far in May sales are down 0.6% from April after that month's 1.0% increase from March. During the last ten years there has been a 45% correlation between the y/y change in chain store sales and the change in nonauto retail sales less gasoline.The ICSC-UBS retail chain-store sales index is constructed using the same-store sales (stores open for one year) reported by 78 stores of seven retailers: Dayton Hudson, Federated, Kmart, May, J.C. Penney, Sears and Wal-Mart.
During the latest week, the leading indicator of chain store sales from ICSC-UBS continued the erratic decline since 2004 with a 0.3% drop.
The chain store sales figures are available in Haver's SURVEYW database.
| ICSC-UBS (SA, 1977=100) | 05/24/08 | 05/17/08 | Y/Y | 2007 | 2006 | 2005 |
|---|---|---|---|---|---|---|
| Total Weekly Chain Store Sales | 488.2 | 488.2 | 1.5% | 2.8% | 3.3% | 3.6% |
by Robert Brusca May 28, 2008

French household confidence is not having a vintage year and its not due to the weather. The household survey is at its lowest level since 1990. Living standards for the next 12-months are assessed as likely to be the worst since 1990. The past 12-months are assessed as having been the worst since 1990. That’s a bad start for the survey right here. But there’s more...
The unemployment expectation is now mid-range at a +18 value. Price developments in the last 12 months are assessed as the worst since 1990. Mercifully, in the period ahead, price developments are scored as in roughly the bottom quartile of their range. The ECB may take some (minor) solace from that.
The favorability of the environment for savings gets a mid-range 47th percentile response but the ability to save rating for the next 12-months is a bottom 10 percentile score. Similarly, the favorability of the environment for spending is in the bottom fifth of its range. The current financial situation is in the bottom third of its range but the past 12-months and future 12-months are assessed as the worst since 1990. I think there is pattern developing here...
French consumers were at first very happy to have Mr Sarkozy in office and confidence ran up even in the face of some clear problems in the aftermath of his election to office. But since then some internal social issues emerged, the euro continued to move higher, and food and energy prices have shot up across Europe as the European economy has slowed down.
Consumers are feeling the pinch in France where various
demonstrations have been petitioning for relief from high fuel prices.
Sarkozy has requested that the EMU’s VAT tax on fuel be capped to help
contain price pressures from rising faster at the pump as energy prices
spurt. While that might help somewhat France’s problems run deeper than
that. Most of the EMU nations seem to be sharing in this sort of pain
although Germany, so far has, expressed the smallest level of
discomfort, but even there discomfort seems to be growing.
| INSEE Household Monthly Survey | ||||||
|---|---|---|---|---|---|---|
| Since Jan 1990 | ||||||
| May-08 | Apr-08 | Mar-08 | Feb-08 | Percentile | Rank | |
| Household Confidence | -41 | -38 | -37 | -36 | 0.0 | 221 |
| Living Standards | ||||||
| past 12 Mos | -74 | -70 | -71 | -69 | 0.0 | 221 |
| Next 12-Mos | -49 | -44 | -41 | -42 | 0.0 | 221 |
| Unemployment: Next 12 | 18 | 4 | 10 | 12 | 50.0 | 140 |
| Price Developments | ||||||
| Past 12Mo | 66 | 58 | 61 | 43 | 100.0 | 1 |
| Next 12-Mos | -36 | -36 | -41 | -25 | 26.4 | 113 |
| Savings | ||||||
| Favorable to save | 21 | 24 | 25 | 23 | 47.2 | 130 |
| Ability to save Next 12 | -20 | -13 | -17 | -14 | 10.3 | 219 |
| Spending | ||||||
| Favorable for major purchase | -31 | -29 | -29 | -27 | 19.0 | 214 |
| Financial Situation | ||||||
| Current | 10 | 12 | 12 | 12 | 33.3 | 138 |
| Past 12 MOs | -32 | -30 | -31 | -27 | 0.0 | 221 |
| Next 12-Mos | -18 | -16 | -14 | -14 | 0.0 | 221 |
| Number of observations in the period | 221 | |||||
by Robert Brusca May 28, 2008
Near term pressures: The German CPI and PPI may have slammed
on the brakes in April but export and import prices are still
advancing- even ex-energy. The German PPI is generally unruly but the
CPI has flattened out over three months with an annual rate of gain of
1.9% and an ex-energy reading of just 1.2%. German export prices in the
past three months are up at a 2.6% rate and imports at a 5.1% rate –
those numbers are not acceptable. While they are
not-seasonally-adjusted, German ex petroleum import prices are up at a
4.7% annual rate – over three-months -- and that is not much of an
improvement over the import headline pace. Moreover, the sequential
growth rates show acceleration in the ex-petrol import price trend,
12-Mo to 6-Mo to 3-Mo, just as for the PPI ex-energy. Even so,
ex-energy CPI prices are decelerating on this series of measures.
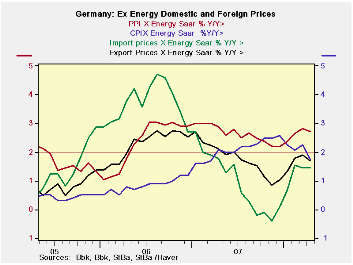
Some progress but not enough: Yr/Yr comparisons show a very different
story, at least for ex-energy prices. German CPI prices are up by 2.5%
overall and by 1.8% ex energy. For imports the total Yr/Yr gains is
5.6% with an ex energy rise of just 1.5%. The chart above shows that
the key German prices Yr/Yr ex-energy all are below the 2% magic number
dictated by the ECB –that is except for the PPI. The ECB, however, does
not recognize any other target or ceiling for inflation except for the
HCIP headline rate and there the ceiling rate is 2% PERIOD.
Are the pressures peaking? Yr/Yr gains in the CPI ex-energy
peaked in December of 2007. Ex petrol import prices peaked in August of
2006. Even the Yr/Yr PPI ex petrol prices shows signs of peaking in the
last few months. Of course with oil prices having spurted again it is
too soon to tell how robust this phenomenon will prove to be. For the
time being year-over-year inflation trends, at least in Germany, seems
to reveal the symptoms of being contained. And the ECB, like the Fed in
the US, seems to prefer gauging inflation on its Yr/Yr performance
instead on a shorter annualized pace. Still, inflation is too high on
the all-important headline measures to let the ECB breathe freely.
Moreover, the ECB has other countries to worry about besides Germany.
Germany is making a solid contribution to an improved EMU rate of
inflation but problems in the zone continue to linger and perhaps to
fester.
| German International and Domestic Inflation Trends | |||||||
|---|---|---|---|---|---|---|---|
| % m/m | % Saar | ||||||
| SA; | Apr-08 | Mar-08 | Feb-08 | 3-Mo | 6-Mo | 12-Mo | Yr-Ago |
| Export Products | 0.1% | 0.1% | 0.5% | 2.6% | 3.2% | 2.2% | 1.9% |
| Import Products | 0.4% | 0.0% | 0.9% | 5.1% | 7.5% | 5.6% | 0.5% |
| NSA | |||||||
| Export excl Petroleum | 0.1% | 0.2% | 0.6% | 3.4% | 2.8% | 1.7% | 2.1% |
| Import excl Petroleum | 0.3% | 0.0% | 0.9% | 4.7% | 3.5% | 1.5% | 1.8% |
| Memo: SA | |||||||
| CPI | 0.0% | 0.4% | 0.1% | 1.9% | 2.7% | 2.5% | 2.1% |
| CPI excl Energy | 0.0% | 0.3% | 0.0% | 1.2% | 1.5% | 1.8% | 2.1% |
| PPI | 0.9% | 0.5% | 0.6% | 8.1% | 7.7% | 5.2% | 1.6% |
| PPI excl Energy | 0.2% | 0.4% | 0.4% | 4.0% | 3.1% | 2.7% | 2.9% |

Tom Moeller
AuthorMore in Author Profile »Prior to joining Haver Analytics in 2000, Mr. Moeller worked as the Economist at Chancellor Capital Management from 1985 to 1999. There, he developed comprehensive economic forecasts and interpreted economic data for equity and fixed income portfolio managers. Also at Chancellor, Mr. Moeller worked as an equity analyst and was responsible for researching and rating companies in the economically sensitive automobile and housing industries for investment in Chancellor’s equity portfolio. Prior to joining Chancellor, Mr. Moeller was an Economist at Citibank from 1979 to 1984. He also analyzed pricing behavior in the metals industry for the Council on Wage and Price Stability in Washington, D.C. In 1999, Mr. Moeller received the award for most accurate forecast from the Forecasters' Club of New York. From 1990 to 1992 he was President of the New York Association for Business Economists. Mr. Moeller earned an M.B.A. in Finance from Fordham University, where he graduated in 1987. He holds a Bachelor of Arts in Economics from George Washington University.
More Economy in Brief


