 Global| Feb 27 2009
U.S. 4Q GDP Revised Down To Show Sharpest Drop Since 1980
by:Tom Moeller
|in:Economy in Brief
Summary
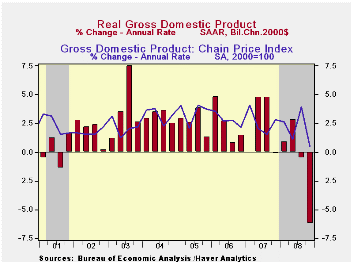
The U.S. Bureau of Economic Analysis today reported that real GDP contracted at a 6.2% annual rate last quarter. It was the largest decline since the "credit crunch" recession of 1980 and it exceeded Consensus expectations for a 5.4% [...]
 The U.S.
Bureau of Economic Analysis today reported that real GDP contracted
at a 6.2% annual rate last quarter. It was the largest
decline since the "credit crunch" recession of 1980 and it exceeded
Consensus expectations for a 5.4% drop. One month ago, the
initial report showed that GDP had declined at a 3.8% rate with
expectations for a 6.0% decline. In the interim, estimates of virtually
all the economy's components were weaker than suggested by certain "top
down" estimates from the labor market, on which the early GDP estimates
are partially based. So, today's figure about matches
month-ago Consensus forecasts.
The U.S.
Bureau of Economic Analysis today reported that real GDP contracted
at a 6.2% annual rate last quarter. It was the largest
decline since the "credit crunch" recession of 1980 and it exceeded
Consensus expectations for a 5.4% drop. One month ago, the
initial report showed that GDP had declined at a 3.8% rate with
expectations for a 6.0% decline. In the interim, estimates of virtually
all the economy's components were weaker than suggested by certain "top
down" estimates from the labor market, on which the early GDP estimates
are partially based. So, today's figure about matches
month-ago Consensus forecasts.
The largest source of the downward revision to GDP growth came from inventory changes which added just 0.2 percentage points to growth instead of the originally estimate of 1.3 points. To some extent this news is somewhat positive for the GDP outlook because it suggests that the "involuntary" accumulation was smaller. Therefore fewer inventories may need to be shed if demand remains under pressure. The 4Q inventory addition to GDP growth followed three consecutive quarters of decumulation or modest accumulation as tight control methods kept inventories under wraps.
The next two sources of downward revision to 4Q GDP are a bit more problematic for the economic growth outlook.
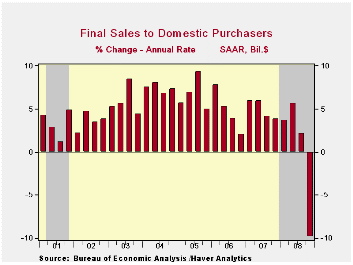 Real
U.S. final sales to domestic purchasers contracted at a 5.7%
annual rate which was greater than the 4.9% estimated last
month. Again, that was the worst decline since the notably
sharp, "credit crunch" recession of 1980 when consumers pocketed their
credit cards. Personal consumption expenditures fell a
downwardly revised 4.3% (AR) which was somewhat greater than the
decline during 3Q. Spending on motor vehicles declined at a
huge 38.0% annual rate, which was quite a bit faster than the 26.6%
decline logged in 3Q. Spending on other durable goods also
fell sharply (-0.7% y/y) as they did during the prior
quarter. Real spending on clothing fell at a somewhat easier
rate (-2.7%) than during 3Q. Business fixed investment fell
at the same rate as estimated last month (-5.0% y/y) and the 22.2%
decline in residential investment (-19.2% y/y) was in fact slightly
less than initially indicated. Combined, business plus
residential investment declined for the tenth quarter out of the last
eleven (-8.8% y/y).
Real
U.S. final sales to domestic purchasers contracted at a 5.7%
annual rate which was greater than the 4.9% estimated last
month. Again, that was the worst decline since the notably
sharp, "credit crunch" recession of 1980 when consumers pocketed their
credit cards. Personal consumption expenditures fell a
downwardly revised 4.3% (AR) which was somewhat greater than the
decline during 3Q. Spending on motor vehicles declined at a
huge 38.0% annual rate, which was quite a bit faster than the 26.6%
decline logged in 3Q. Spending on other durable goods also
fell sharply (-0.7% y/y) as they did during the prior
quarter. Real spending on clothing fell at a somewhat easier
rate (-2.7%) than during 3Q. Business fixed investment fell
at the same rate as estimated last month (-5.0% y/y) and the 22.2%
decline in residential investment (-19.2% y/y) was in fact slightly
less than initially indicated. Combined, business plus
residential investment declined for the tenth quarter out of the last
eleven (-8.8% y/y).
The government sector contributed marginally to GDP growth last quarter. Activity rose at a 1.6% annual rate (3.3% y/y) led by a 6.7% (8.2% y/y) rise in Federal spending.
Finally, the foreign trade sector subtracted 0.5 percentage points from GDP growth instead of adding minimally. It was the first negative contribution from trade to U.S. growth since 1Q 2007. Exports fell at a deepened 23.6% rate (-1.8% y/y) as recessions intensified in economies abroad. U.S. imports fell at a 16.0% rate (-7.1% y/y) with the developing domestic recession, which was about the same rate of decline estimated last month.
Adding to the overall downward
estimate of GDP growth was an upward revision to price
inflation. 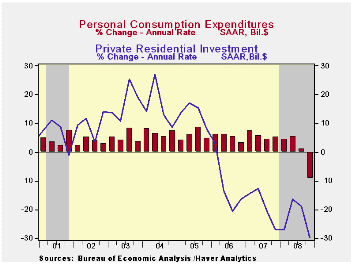 The GDP chain price index
increased at a 0.5% rate instead of falling minimally. The
source of the upward revision to the price index appears to have come
from inventories. The PCE price index fell at a 5.0% annual
rate versus a drop of 5.5% in the initial report. prices. The
residential investment chain price index fell at a 9.6% annual rate
while the business fixed investment price index rose 4.6%, about as
presented last month.
The GDP chain price index
increased at a 0.5% rate instead of falling minimally. The
source of the upward revision to the price index appears to have come
from inventories. The PCE price index fell at a 5.0% annual
rate versus a drop of 5.5% in the initial report. prices. The
residential investment chain price index fell at a 9.6% annual rate
while the business fixed investment price index rose 4.6%, about as
presented last month.
The U.S. National Income & Product Account data is available in Haver's USECON and the USNA databases.
Sources of the Great Moderation: shocks, friction, or monetary policy? from the Federal Reserve Bank of San Francisco is available here.· Ties that bind: bilateral trade's role in synchronizing business cycles from the Federal Reserve Bank of Dallas can be found here.
| Chained 2000$, % AR | 4Q '08 (Preliminary) | 4Q '08 (Advance) | 3Q '08 | 4Q Y/Y | 2008 | 2007 | 2006 |
|---|---|---|---|---|---|---|---|
| GDP | -6.2 | -3.8 | -0.5 | -0.8 | 1.3 | 2.0 | 2.8 |
| Inventory Effect | 0.2 | 1.3 | 0.8 | 0.1 | 0.1 | -0.4 | 0.0 |
| Final Sales | -6.4 | -5.1 | -1.3 | -0.7 | 1.4 | 2.4 | 2.8 |
| Foreign Trade Effect | -0.5 | 0.1 | 1.1 | 1.4 | 1.4 | 0.6 | 0.2 |
| Domestic Final Demand | -5.7 | -4.9 | -2.2 | -1.7 | 0.0 | 1.8 | 2.6 |
| Chained GDP Price Index | 0.5 | -0.1 | 3.9 | 2.0 | 2.2 | 2.7 | 3.2 |

Tom Moeller
AuthorMore in Author Profile »Prior to joining Haver Analytics in 2000, Mr. Moeller worked as the Economist at Chancellor Capital Management from 1985 to 1999. There, he developed comprehensive economic forecasts and interpreted economic data for equity and fixed income portfolio managers. Also at Chancellor, Mr. Moeller worked as an equity analyst and was responsible for researching and rating companies in the economically sensitive automobile and housing industries for investment in Chancellor’s equity portfolio. Prior to joining Chancellor, Mr. Moeller was an Economist at Citibank from 1979 to 1984. He also analyzed pricing behavior in the metals industry for the Council on Wage and Price Stability in Washington, D.C. In 1999, Mr. Moeller received the award for most accurate forecast from the Forecasters' Club of New York. From 1990 to 1992 he was President of the New York Association for Business Economists. Mr. Moeller earned an M.B.A. in Finance from Fordham University, where he graduated in 1987. He holds a Bachelor of Arts in Economics from George Washington University.
More Economy in Brief


