 Global| Mar 27 2008
U.S. 4Q GDP Growth Unrevised at 0.6%, Profits Fell
by:Tom Moeller
|in:Economy in Brief
Summary
U.S. real GDP growth during 4Q '07 was unrevised, as expected, at 0.6% (AR). Growth during the last two quarters was down sharply from an average gain during the prior two periods of 4.4%. Reported for the first time were corporate [...]

U.S. real GDP growth during 4Q '07 was unrevised, as expected, at 0.6% (AR). Growth during the last two quarters was down sharply from an average gain during the prior two periods of 4.4%.
Reported for the first time were corporate profits and overall earnings fell 3.3% from 3Q (+2.5% y/y). Profits of domestic nonfinancial corporations fell 4.3% (-0.0% y/y) for the second consecutive quarterly decline. The housing sector's meltdown reduced financial sector corporate profits by a much sharper 15.2% (-16.4% y/y) while those declines were offset somewhat by the strength of overseas earnings. They grew 16.4% (42.8% y/y).
In the GDP detail, improvement in the foreign trade deficit continued to add sharply to overall growth, as it did in the third quarter. 4Q imports are now shown to have declined at a little revised 1.4% (+1.0% y/y) rate. Export growth, however, was revised up to 6.5% (8.4% y/y).
The added addition to GDP growth from foreign trade was offset
by a greater 1.8 percentage point subtraction from inventory
decumulation.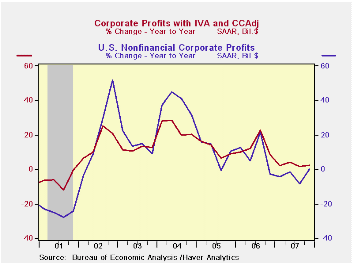
Domestic demand growth was little changed as the gain in final sales to domestic purchasers is still estimated slower at 1.3%. The decline in residential construction was unrevised at a sharp 25.2% (-18.6% y/y) rate of decline. That reduced overall real GDP growth by 1.3 percentage points. Growth in business fixed investment grew a little revised 6.0% (7.1% y/y) as equipment spending slowed to a 3.1% (3.6% y/y) growth rate. Nonresidential construction during 4Q grew an accelerated 12.4% (15.1% y/y). Growth in real personal consumption was raised slightly to 2.3% (2.6% y/y).
Growth in the GDP chain price index was lowered slightly to a 2.4% (AR) gain. The PCE price index rose at a reduced 3.9% rate (3.4% y/y). Less food & energy consumer prices was taken down a notch to a 2.5% (2.1% y/y) growth rate. Prices of business fixed investment rose 1.1% (0.6% y/y) but residential investment prices fell at a 0.4% (+0.1% y/y) rate.
Protecting Homeowners and Sustaining Homeownership is this morning's speech by Fed Governor Randall S. Kroszner and it can be found here.
Monetary Policy Actions and Long-Run Inflation Expectations is from the Federal Reserve Board and it can be found here.
| Chained 2000$, % AR | 4Q '07 (Final) | 4Q '07 (Preliminary) | 4Q '07 (Advance) | 3Q '07 | Y/Y | 2007 | 2006 | 2005 |
|---|---|---|---|---|---|---|---|---|
| GDP | 0.6 | 0.6 | 0.6 | 4.9 | 2.5 | 2.2 | 2.9 | 3.1 |
| Inventory Effect | -1.8 | -1.5 | -1.3 | 0.9 | -0.2 | -0.3 | 0.1 | -0.2 |
| Final Sales | 2.4 | 2.1 | 1.9 | 4.0 | 2.8 | 2.5 | 2.8 | 3.3 |
| Foreign Trade Effect | 1.0 | 0.9 | 0.4 | 1.4 | 0.8 | 0.7 | -0.1 | -0.2 |
| Domestic Final Demand | 1.3 | 1.2 | 1.4 | 2.5 | 1.9 | 1.8 | 2.7 | 3.3 |
| Chained GDP Price Index | 2.4 | 2.7 | 2.6 | 1.0 | 2.6 | 2.7 | 3.2 | 3.2 |
by Tom Moeller March 27, 2008
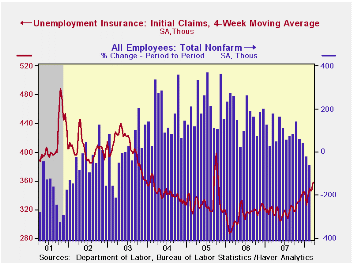
Initial unemployment insurance claims fell back last week by 9,000 to 366,000 after an upwardly revised 28,000 increase during the prior week. The latest was near the highest level since September 2005. Consensus expectations had been for 370,000 initial claims last week. So far in March claims have averaged 363,000, up 1.1% from the February average. (Prior years' figures were revised.)
A claims level below 400,000 typically has been associated
with growth in nonfarm payrolls. During the last ten years there has
been a (negative) 76% correlation between the level of initial claims
and the m/m change in nonfarm payroll employment.
The four week moving average of initial claims fell slightly to 360,250 (13.6% y/y).
Continuing claims for unemployment insurance fell slightly by 5,000 after the upwardly revised 57,000 increase during the prior week. Insured unemployment is at its highest level since mid 2005. The figure provides some indication of workers' ability to find employment.
The continuing claims numbers lag the initial claims figures by one week.
The insured rate of unemployment held at 2.1%.
No Volatility, No Forecasting Power for the Term Spread from the Federal Reserve Bank of St. Louis can be found here.
| Unemployment Insurance (000s) | 03/21/08 | 03/14/08 | Y/Y | 2007 | 2006 | 2005 |
|---|---|---|---|---|---|---|
| Initial Claims | 366 | 375 | 18.1% | 322 | 313 | 331 |
| Continuing Claims | -- | 2,845 | 13.8% | 2,551 | 2,459 | 2,662 |
by Tom Moeller March 27, 2008
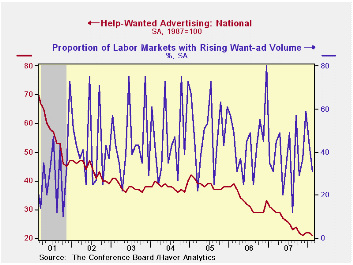
The index of help-wanted advertising reported by the Conference Board dipped last month to a reading of 21 from an upwardly revised 22 in January. The latest level was equal to the record low hit last November.
During the last ten years there has been a 57% correlation between the level of help-wanted advertising and the three month change in non-farm payrolls.
The proportion of labor markets with rising want-ads fell even further to 31% after the January decline to 43% from 59% in December. Each figure still is an improvement from 12% in August which was the lowest monthly reading since October 2001.
Each region of the country showed a m/m decline in its help wanted index except the West South Central region.
The Conference Board also surveys help-wanted print advertising volume in 51 major newspapers across the country every month. The latest help wanted report from the Conference Board is available here.In 2006, the Conference Board introduced its Help Wanted Online Data Series and the latest release can be found in this link.
FedViews is from the Federal Reserve Bank of San Francisco an it can be found here.
| Conference Board | February | January | February 2007 | 2007 | 2006 | 2005 |
|---|---|---|---|---|---|---|
| National Help Wanted Index | 21 | 22 | 30 | 26 | 33 | 39 |
by Robert Brusca March 27, 2008

The climate indicator for France’s Service sector noted lower by one point in March continuing a slip that began in mid-2007. The index now stands in the 77th percentile of its range of values since 2000. The climate outlook is weaker in the 67th percentile of its range.
The past observed sales rating is the best of the period at the top of its range since 2000 but the 3-month ahead expected result is only in the 48th percentile of its range, a sharp reversal in expectations form current conditions. Sales prices are expected are moderately high in the 70th percentile of their range. Employment while in the 92nd percentile as observed over the past three months is rated in the 70th percentile of its range for the next 3 months. Expectations are shifting lower in France’s services sector.
| France INSEE Services Survey Jan 2000-date | ||||||||||
|---|---|---|---|---|---|---|---|---|---|---|
| Mar 08 |
Feb 08 |
Jan 08 |
Dec 07 |
%tile | Rank | Max | Min | Range | Mean | |
| Climate Indicator | 104 | 105 | 108 | 108 | 70.0 | 44 | 113 | 83 | 30 | 102 |
| Climate: 3Mo MAV | 106 | 107 | 109 | 111 | 74.7 | 31 | 113 | 85 | 28 | 102 |
| Climate: 12Mo MAV | 110 | 110 | 110 | 110 | 96.6 | 7 | 110 | 91 | 20 | 101 |
| Outlook | -1 | -1 | 2 | 3 | 67.7 | 41 | 9 | -22 | 31 | -1 |
| Sales | ||||||||||
| Observed over past 3 Months | 18 | 13 | 13 | 15 | 100.0 | 1 | 18 | -11 | 29 | 6 |
| Expected over next 3 Months | 3 | 10 | 14 | 8 | 48.1 | 62 | 17 | -10 | 27 | 7 |
| Sales Price | ||||||||||
| Observed over past 3 Months | 1 | 1 | 1 | 1 | 41.7 | 21 | 8 | -4 | 12 | 0 |
| Expected over next 3 Months | 2 | 0 | 0 | 0 | 70.0 | 11 | 5 | -5 | 10 | 0 |
| Employment | ||||||||||
| Observed over past 3 Months | 15 | 17 | 7 | 15 | 92.9 | 2 | 17 | -11 | 28 | 4 |
| Expected over next 3 Months | 12 | 19 | 14 | 11 | 70.8 | 7 | 19 | -5 | 24 | 5 |
by Robert Brusca March 27, 2008
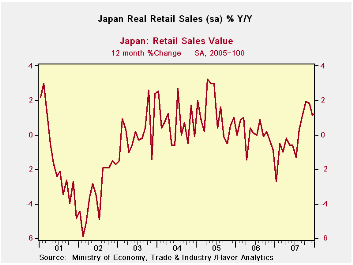
Japanese retail sales strengthened late in 2007 but are giving those gains back in Q1 2008. Inflation adjusted retail sales fell by 1% in February 2008, unwinding the 0.8% gain in January. In the quarter-to-date real retail sales are now shrinking at a 0.6% annual rate. The inflation adjusted retail trends are somewhat distressed.
The detail for Japan’s retail sales is not seasonally adjusted or inflation adjusted. But for those flows we can compare the last 12-month pace with that of 12-month previous to that (Yr-Ago). On that basis there has been improvement across most of the retail sales components. Growth is better over the recent 12 months than over the previous 12 months, except for food and beverages.
| Japan Retail Sales Trends | ||||||||
|---|---|---|---|---|---|---|---|---|
| Feb-08 | Jan-08 | Dec-07 | 3-mo | 6-mo | 12-mo | Yr-Ago | Q-to-Date | |
| Total SA | -1.0% | 0.8% | -0.7% | -3.5% | -2.0% | -0.4% | -2.0% | -0.6% |
| Not seasonally adjusted | ||||||||
| Total: Nominal | 2.4% | 0.6% | -0.8% | 8.8% | 4.9% | 3.2% | -0.6% | 7.2% |
| Motor Vehicles | -3.0% | 2.9% | -0.8% | -4.2% | -3.0% | 3.3% | -18.8% | 3.7% |
| Food& Beverage | 1.9% | 0.2% | -0.2% | 7.6% | 4.6% | 2.1% | 6.2% | 4.7% |
| Fabric apparel& access | 5.0% | 1.2% | -2.6% | 14.7% | 4.7% | 2.3% | 0.9% | 12.0% |
| Rest of Retail | 3.5% | 0.2% | -0.9% | 11.7% | 6.9% | 3.9% | -0.2% | 8.7% |

Tom Moeller
AuthorMore in Author Profile »Prior to joining Haver Analytics in 2000, Mr. Moeller worked as the Economist at Chancellor Capital Management from 1985 to 1999. There, he developed comprehensive economic forecasts and interpreted economic data for equity and fixed income portfolio managers. Also at Chancellor, Mr. Moeller worked as an equity analyst and was responsible for researching and rating companies in the economically sensitive automobile and housing industries for investment in Chancellor’s equity portfolio. Prior to joining Chancellor, Mr. Moeller was an Economist at Citibank from 1979 to 1984. He also analyzed pricing behavior in the metals industry for the Council on Wage and Price Stability in Washington, D.C. In 1999, Mr. Moeller received the award for most accurate forecast from the Forecasters' Club of New York. From 1990 to 1992 he was President of the New York Association for Business Economists. Mr. Moeller earned an M.B.A. in Finance from Fordham University, where he graduated in 1987. He holds a Bachelor of Arts in Economics from George Washington University.
More Economy in Brief


