 Global| Dec 23 2008
U.S. 3Q'08 GDP Growth Unrevised; Profit's Fall Little Changed
by:Tom Moeller
|in:Economy in Brief
Summary
As roughly indicated in the prior two reports, 3Q08 U.S. real GDP growth slipped 0.5%. The latest figure matched Consensus expectations. The y/y rate of growth of 0.7% continued as the weakest since the end of the 2001 recession. [...]
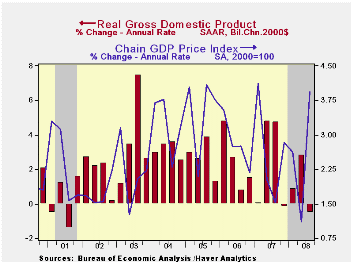
As roughly indicated in the prior two reports, 3Q08 U.S. real GDP growth slipped 0.5%. The latest figure matched Consensus expectations. The y/y rate of growth of 0.7% continued as the weakest since the end of the 2001 recession.
Corporate profits also were little revised
and they posted a 1.2% drop and were down 9.2% y/y. Last quarter's
decline was the seventh drop of the last eight quarters and the y/y
change was the weakest since the 2001 recession. The financial sector's
travails continued to lead profits lower. They were revised weaker and
down by roughly one-third from the year ago level. Domestic
nonfinancial corporations fell a little-revised 4.3% y/y. Finally,
repatriated earnings from abroad rose 6.2% y/y which was slightly
better than reported initially.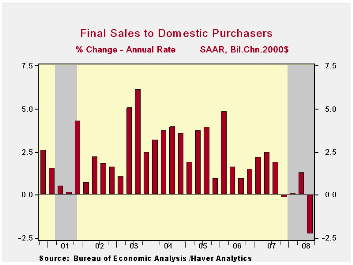
Real U.S. final sales to domestic purchasers were little revised and they posted a 2.2% drop. That remained the largest quarterly decline since the end of the 1990-91 recession. The year-to-year dip of 0.2% was the first decline since 1991.
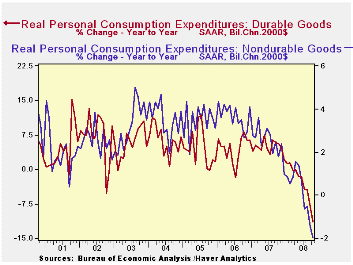
Personal consumption expenditures fell at a 3.8% annual rate (-0.2% y/y). Spending on autos & light trucks collapsed at a 26.6% annual rate (-15.0% y/y). Real spending on furniture & other household equipment fell at an 8.2% rate but they were still up 2.6% y/y. Real spending on apparel fell at a 13.3% clip (-1.1% y/y) and that more than reversed a 2Q jump. Spending on consumer services slipped 0.1% and the y/y gain of 1.1% was the weakest since 1981.
Residential construction fell a little
revised 16.1% (-20.6% y/y) and subtracted 0.7% points from GDP growth.
The 1.7% decline in business fixed investment was little revised (+1.6% y/y). Equipment investment fell at a 7.5% rate (-3.1% y/y), the third consecutive quarter of decline while structures investment was firm again and rose at an upwardly revised 9.6% annual rate (11.2% y/y).
Inventory accumulation was little revised and added 0.8 percentage points to GDP growth after three consecutive quarters of subtraction.
An improved foreign trade deficit added the same 1.1 percentage points to U.S. growth as estimated last month and it remained the main source of lift to GDP growth. The addition was, however, almost one third of that in 2Q. Exports grew at a slower 3.0% annual rate (6.1% y/y), half that in 2Q. Growth in imports weakened with the slowdown in overall economic growth and they fell at a 3.5% annual rate (-3.5% y/y). It was the fifth quarterly decline in the last six.
Spending by governments was strong again and rose 5.8% (3.1% y/y). That was little revised and the quickest since early 2003.
The estimate of the GDP chain price index was lowered to a still-strong 3.9% (AR) gain. The downward revision was due to a lowered jump in the PCE price index to 4.3%. Capital spending prices rose at an accelerated 4.2% rate (2.2% y/y) while the residential investment price deflator was revised downward and declined at a 2.4% rate; down for the fourth straight quarter (-2.4% y/y).
Agricultural Markets and Food Price Inflation - A conference summary from the Federal Reserve Bank of Chicago is available here.
| Chained 2000$, % AR | 3Q '08 (Final) | 3Q '08 (Preliminary) | 3Q '08 (Advance) | 2Q '08 | 3Q Y/Y | 2007 | 2006 | 2005 |
|---|---|---|---|---|---|---|---|---|
| GDP | -0.5 | -0.5 | -0.3 | 2.8 | 0.7 | 2.0 | 2.8 | 2.9 |
| Inventory Effect | 0.8 | 0.9 | 0.6 | -1.5 | -0.4 | -0.4 | 0.0 | -0.2 |
| Final Sales | -1.3 | -1.4 | -0.8 | 4.4 | 1.2 | 2.4 | 2.8 | 3.1 |
| Foreign Trade Effect | 1.1 | 1.1 | 1.1 | 2.9 | 1.4 | 0.6 | 0.2 | 0.0 |
| Domestic Final Demand | -2.2 | -2.3 | -1.8 | 1.3 | -0.2 | 1.8 | 2.6 | 3.1 |
| Chained GDP Price Index | 3.9 | 4.2 | 4.2 | 1.1 | 2.6 | 2.7 | 3.2 | 3.3 |
by Tom Moeller December 23, 2008
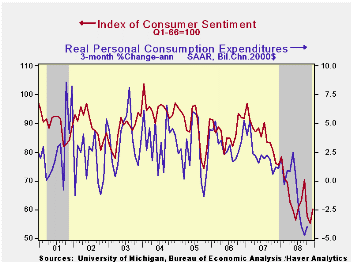
The full-month reading of consumer sentiment in December from the University of Michigan recovered slightly from the the dismal November level. At 60.1 the figure was improved slightly from the mid-month level and that was up 8.7% from November. It was the highest level since September. It still was down, however, by nearly one quarter from last year. The December reading beat Consensus expectations for 58.7.
During the last ten years there has been a 58% correlation between the level of sentiment and the three-month change in real consumer spending.
The same as in the mid-month report, weak prices most likely
pushed up the index of buying conditions for large household goods by
one-third from November. The view of current personal finances improved
just slightly from November's record low level, and the figure remained
off by nearly one half from last year's average.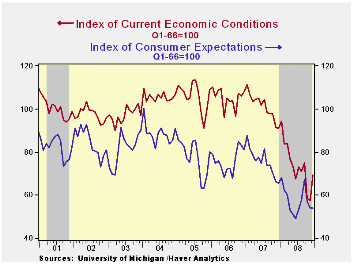
The expectations component of consumer sentiment remained
roughly unchanged m/m. The series was near its lowest since 1990 and
close to the low of 1980. Expectations for business conditions during
the next year dropped to the lowest since 1980 and expectations for
conditions during the next five years ticked up. The expected change in
personal finances improved slightly for the second consecutive month.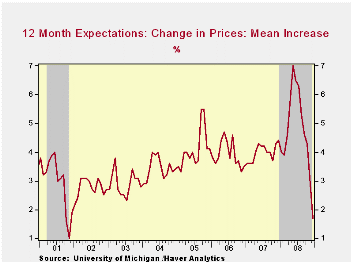
The opinion of government policy, which apparently influences economic expectations, ticked up for the second month (-25.7% y/y). A higher 45% thought that a fair job was being done but a lesser 4% thought that a good job was being done. That was nearly the lowest percentage on record. Forty nine percent of survey participants thought that a poor job was being done by government.
Recent economic weakness and lower oil prices caused inflation expectations to fall. The mean expected rate of inflation during the next year fell further to 1.7%. It was as high as 7.0% in May. The expected inflation rate during the next five years fell to 2.6%, a record low for the series which dates back to 1980.
The University of Michigan survey is not seasonally adjusted.The reading is based on telephone interviews with about 500 households at month-end; the mid-month results are based on about 300 interviews. The summary indexes are in Haver's USECON database, with details in the proprietary UMSCA database.
| University of Michigan | December | Mid-December | November | October | December y/y | 2007 | 2006 | 2005 |
|---|---|---|---|---|---|---|---|---|
| Consumer Sentiment | 60.1 | 59.1 | 55.3 | 57.6 | -20.4% | 85.6 | 87.3 | 88.5 |
| Current Conditions | 69.5 | 69.4 | 57.5 | 58.4 | -23.6 | 101.2 | 105.1 | 105.9 |
| Expectations | 54.0 | 52.4 | 53.9 | 57.0 | -17.7 | 75.6 | 75.9 | 77.4 |
by Tom Moeller December 23, 2008

Regular gasoline prices were roughly unchanged last week at $1.65 per gallon, according to the U.S. Department of Energy survey. Yesterday, the spot market price for a gallon of regular gasoline fell sharply to $0.88 per gallon.
Weekly gasoline prices can be found in Haver's WEEKLY database. Daily prices are in the DAILY database.
Though gasoline prices are down, that has done little to drive
up product demand. The U.S. Department of Energy reported that the demand
for gasoline fell by 3.5% y/y, nearly the fastest rate of
decline since late-1995 (the latest four weeks versus the same four
weeks last year). The demand for all petroleum
products also fell 4.9% y/y.
These DOE figures are available in Haver's OILWKLY database.
The price for a barrel of West Texas Intermediate crude oil fell last week by five dollars from the prior week's average to $39.65 per barrel, down by two-thirds since the peak in July of $145.66. In futures trading yesterday, the one-month price for crude oil was $39.91.
Last week, prices for natural gas were unchanged w/w at $5.67 per mmbtu (-20.7% y/y). The latest average price was 50% below natural gas prices in early-July of $13.19/mmbtu.
The Yield Curve from the Federal Reserve Bank of Cleveland is available here.
| Weekly Prices | 12/22/08 | 12/15/08 | Y/Y | 2007 | 2006 | 2005 |
|---|---|---|---|---|---|---|
| Retail Regular Gasoline ($ per Gallon) | 1.65 | 1.66 | -44.5% | 2.80 | 2.57 | 2.27 |
| Light Sweet Crude Oil, WTI ($ per bbl.) | 39.65 | 44.71 | -56.6% | 72.25 | 66.12 | 56.60 |
by Tom Moeller December 23, 2008
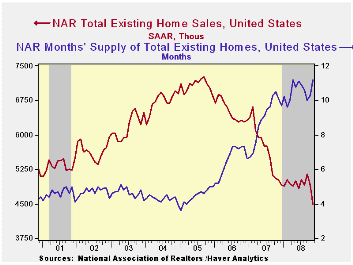
U.S. existing home sales fell 8.6% last month versus October to pull sales down to 4,490 million, according to the National Association of Realtors. The decline during the prior month was revised slightly and the latest was much greater than Consensus expectations for sales of 4.93M homes. Total sales include sales of condos and co-ops.
Median home prices fell 2.8% (NSA) last
month, about as they did during October and it was the fifth
consecutive monthly drop. That pulled the y/y comparison to -13.2%.
Prices have fallen 21.0% since their peak in June 2007.
Sales of existing single-family homes followed a similar pattern as the total and fell 8.0% after a revised 4.6% during October. Sales of existing homes are down by one-third from their peak in mid-2005.
The latest drop in single-family home sales was to the lowest since 1997, is from a trend line this year that had been roughly stable and moving sideways.
By region, home sales in the Northeast led last month's decline with a 12.0% drop and they were down nearly twenty percent from last year. In the South sales also were quite weak as they posted a 10.9% drop. In the West sales sales fell about they did during October, by 4.3%. Sales in the Midwest fell 7.4%, like they did during October.
The number of unsold homes (condos & single-family) on the market ticked up 0.1%, about as they did year-to-year. At the current sales rate there as a 11.2 months' supply on the market which was near the series' high.. For single-family homes the inventory rose m/m to a 10.6 months supply at the current sales rate, also near the high.
| Existing Home Sales (Thous) | November | y/y % | October | November '07 | 2007 | 2006 | 2005 |
|---|---|---|---|---|---|---|---|
| Total | 4,490 | -10.6 | 4,910 | 5,020 | 5,672 | 6,508 | 7,076 |
| Northeast | 730 | -18.0 | 830 | 890 | 1,008 | 1,090 | 1,168 |
| Midwest | 1,000 | -16.0 | 1,080 | 1,190 | 1,331 | 1,491 | 1,589 |
| South | 1,640 | -17.6 | 1,840 | 1,990 | 2,240 | 2,576 | 2,704 |
| West | 1,120 | 17.9 | 1,170 | 950 | 1,093 | 1,353 | 1,617 |
| Single-Family | 4,020 | -8.8 | 4,370 | 4,410 | 4,958 | 5,703 | 6,181 |
| Median Price, Total, $ | 181,300 | -13.2 | 186,500 | 208,800 | 216,617 | 222,000 | 218,217 |
by Robert Brusca December 23, 2008
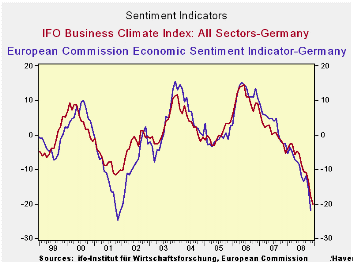
With the release of the new detail, the IFO headline has not
changed but the report now reveals how impacted the whole of the survey
is from the ongoing weakness and gathering gloom.
Germany’s IFO headline at 82.6 in Dec. from 96.3 in Nov. is
now the weakest since 1991. The current manufacturing situation is in
the bottom 19th percent of its range for that period. Business
expectations, activity and orders on hand all are the worst readings on
record for the period. The reading for ‘Foreign orders on hand’ is now
the relative strongest category and it resides in the bottom 25% of its
range.
The three-month outlook for expected MFG activity has slipped
to its weakest reading of the period since 1998. Orders, expectations
for Retailing and Wholesaling are around the bottom 20% of their
respective ranges. Despite foreign orders on hand having held up the
expectations for export business on the part of manufactures is the
worst of the survey period. Employment expectations in manufacturing
are also their worst of the period. The German IFO survey leaves little
cheer for Christmas.
| IFO Survey: Germany | ||||||||
|---|---|---|---|---|---|---|---|---|
| Percent: Yr/Yr | INDEX NUMBERS | |||||||
| Dec-08 | Nov-08 | Oct-08 | Sep-08 | Aug-08 | Current | Average | Percentile | |
| Biz Climate | -20.0% | -17.8% | -13.4% | -10.9% | -10.5% | 82.6 | 96.3 | 0.0% |
| Current Situation | -18.1% | -14.2% | -8.9% | -9.4% | -7.5% | 88.8 | 96.3 | 18.0% |
| Biz Expectations: Next 6-Mos | -22.0% | -21.3% | -17.6% | -12.6% | -13.4% | 76.8 | 96.4 | 0.0% |
| Manufacturing: | Dec-08 | Nov-08 | Oct-08 | Sep-08 | Aug-08 | Current | Average | Percentile |
| Current Situation | ||||||||
| MFG | -25.8% | -19.5% | -12.4% | -11.9% | -8.9% | 81.1 | 93.5 | 19.6% |
| Biz Expectations: Next 6-Mos | ||||||||
| MFG | -27.0% | -25.4% | -21.5% | -15.8% | -16.9% | 70.8 | 95.8 | 0.0% |
| Activity (m/m) | ||||||||
| MFG | -25.1% | -17.8% | -7.7% | -10.1% | -8.5% | 75.1 | 96.9 | 0.0% |
| Demand M/M | ||||||||
| MFG | -27.5% | -25.8% | -15.3% | -16.0% | -10.8% | 70.1 | 96.5 | 0.0% |
| Orders on hand | ||||||||
| MFG | -26.7% | -22.5% | -13.2% | -14.7% | -11.2% | 73.6 | 96.1 | 0.0% |
| Foreign orders on hand | ||||||||
| MFG | -23.3% | -17.6% | -14.0% | -9.7% | -7.7% | 84.6 | 94.8 | 24.5% |
| Yr/Yr percentage changes in underlying Indices | ||||||||
| IFO outlook for 3-Months ahead | ||||||||
| 3-Mos ahead | Percent: Yr/Yr | INDEX NUMBERS | ||||||
| Expected Activity | Dec-08 | Nov-08 | Oct-08 | Sep-08 | Aug-08 | Current | Average | Percentile |
| MFG | -24.8% | -22.2% | -13.9% | -9.2% | -10.8% | 77.3 | 96.7 | 0.0% |
| Orders Expectations | Changes over 12-months | |||||||
| Retail Orders | -22.0% | -24.0% | -5.0% | -4.0% | -10.0% | -32.0 | -16.1 | 22.4% |
| Wholesale | -32.0% | -30.0% | -16.0% | -12.0% | -15.0% | -26.0 | -12.4 | 17.9% |
| EXPORT Biz Expectations | ||||||||
| MFG | -23.3% | -19.0% | -13.3% | -9.6% | -7.2% | 80.7 | 98.1 | 0.0% |
| Employment Expectations | ||||||||
| MFG (Since June 1997) | -20.6% | -15.5% | -9.8% | -8.7% | -8.3% | 87.4 | 96.2 | 0.0% |
by Louise Curley December 23, 2008
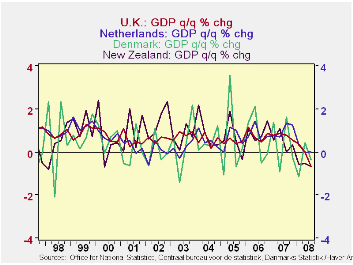
The United Kingdom, the United States, Denmark, the Netherlands and New Zealand released their, for the most part, final estimates of Gross Domestic Product for the third quarter of 2008 today. The quarterly percent changes in GDP for New Zealand, Denmark, the Netherlands and the U.K. are shown in the first chart.
All five countries appear to be in recession or heading
towards it although their paths are diverse. The data show that New
Zealand has now reported three successive quarters of decline and is
definitely in recession. After a rebound in the second quarter, Denmark
has once again reported a decline in GDP. GDP in the Netherlands has
hovered around zero growth in all three quarters of 2008. GDP in the U.
K. declined 0.65% in the third quarter, more than expected and the
biggest decline since 1990. GDP in Denmark declined 0.38% in the third
quarter after rising 0.43% in the second quarter. As can be seen in the
first chart, quarterly movements in Denmark's GDP are much more
volatile than those of the other countries shown.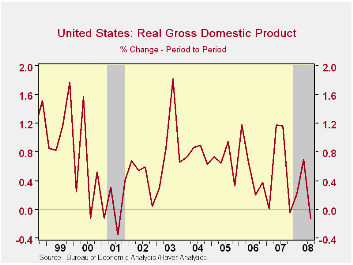
GDP in the United States, which had declined 0.04% in the fourth quarter of 2007, increased by 0.22 % in the first quarter of 2008 and 0.70% in the second quarter, declined 0.13% in the third quarter. (The U. S. typically shows quarterly changes in GDP at annual rates, while most other countries use quarterly changes such as those shown here. The comparable annual rate figures for the U. S. are -0.17%, 0.87% , 2.83 % and -0.51% respectively.)
The National Bureau of Economic Research, the arbiter of recession dating in the U. S., has declared the fourth quarter of 2007 to be the peak of the expansion and thus the first quarter of 2008, the beginning of recession. Quarterly changes in the GDP of the U. S together with recession shading are shown in the second chart. Other countries have yet to make an official announcement, but when they do, Haver will record the recession dating and shading in the Graph Menu in DLXVG3.
| QUARTERLY CHANGES IN GDP | Q3 08 | Q2 08 | Q1 08 | Q4 07 |
|---|---|---|---|---|
| New Zealand | -0.68 | -0.52 | -0.57 | 0.33 |
| Denmark | -0.38 | 0.43 | -1.16 | -0.23 |
| The Netherlands | -0.02 | 0.00 | 0.33 | 1.25 |
| United Kingdom | -0.65 | 0.00 | 0.38 | 0.55 |
| United States | -0.13 | 0.70 | 0.22 | -0.04 |

Tom Moeller
AuthorMore in Author Profile »Prior to joining Haver Analytics in 2000, Mr. Moeller worked as the Economist at Chancellor Capital Management from 1985 to 1999. There, he developed comprehensive economic forecasts and interpreted economic data for equity and fixed income portfolio managers. Also at Chancellor, Mr. Moeller worked as an equity analyst and was responsible for researching and rating companies in the economically sensitive automobile and housing industries for investment in Chancellor’s equity portfolio. Prior to joining Chancellor, Mr. Moeller was an Economist at Citibank from 1979 to 1984. He also analyzed pricing behavior in the metals industry for the Council on Wage and Price Stability in Washington, D.C. In 1999, Mr. Moeller received the award for most accurate forecast from the Forecasters' Club of New York. From 1990 to 1992 he was President of the New York Association for Business Economists. Mr. Moeller earned an M.B.A. in Finance from Fordham University, where he graduated in 1987. He holds a Bachelor of Arts in Economics from George Washington University.
More Economy in Brief


