 Global| Sep 26 2008
U.S. 2Q'08 GDP Growth Lowered Slightly
by:Tom Moeller
|in:Economy in Brief
Summary
Second quarter '08 U.S. real GDP growth was revised down slightly to 2.8% from the preliminary estimate of 3.3% growth. Despite the revision, last quarter's growth was the quickest since the third quarter of last year but it fell [...]
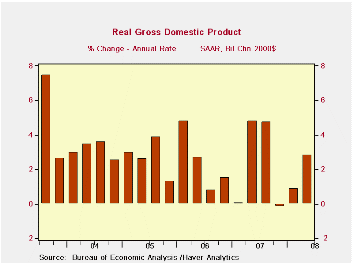
Second quarter '08 U.S. real GDP growth was revised down slightly to 2.8% from the preliminary estimate of 3.3% growth. Despite the revision, last quarter's growth was the quickest since the third quarter of last year but it fell short of Consensus expectations for no revision to the earlier estimate.
A reduced estimate of growth in final sales to domestic purchasers was the source of the revision. It was taken down to a 1.3% rate of increase. The increase followed two quarters of no change in the level of domestic demand.
Real personal consumption grew a bit
slower than estimated earlier, at 1.2% (1.3% y/y). The tax rebate
checks presumably helped growth improve from the 0.9% figure averaged
during the prior two quarters, but it seems to have been slight.
Spending on autos & light trucks fell at a 19.7% (-9.8% y/y)
annual rate while spending on furniture & other household
equipment jumped at a 14.0% (7.0% y/y) rate. Spending on apparel surged
at a 10.9% (3.6% y/y) rate. Growth in real PCE added 0.9 percentage
points to 2Q real GDP growth after a 0.6 point add during 1Q. The 2Q
addition was revised down from a 1.2% addition mostly due to a lowered
figure for growth in services spending to 0.7% (1.7% y/y).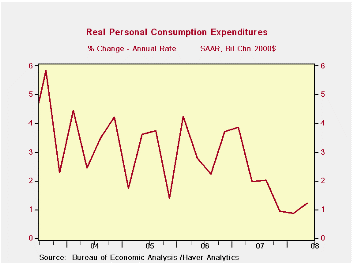
Residential construction fell a bit less than estimated earlier. Nevertheless, the 13.3% annual rate of decline (-21.6% y/y) still subtracted 0.5 percentage points from 2Q GDP growth after subtractions exceeding 1.0 points during the prior two quarters.
Growth in business fixed investment was held roughly steady at 2.5% (4.2% y/y). These latest rates of growth are down sharply from 4.9% increases last year and growth above 7.0% during 2006 and 2005. Last quarter, equipment investment fell at a downwardly revised 5.0% (-0.3% y/y) rate while structures investment jumped at an upwardly revised 18.4% (13.9% y/y) rate.
Growth in corporate profits was revised lower to -14.3% (AR, -8.3% y/y). Profitability in the financial sector was reduced sharply to a 27.1% (-20.4% y/y) rate of decline which compared to an estimated 26.5% rate of advance estimated earlier. Conversely, the decline in domestic nonfinancial profitability was lessened to -2.1% (-12.6% y/y) but it was still the sixth drop in profits in the last seven quarters. Foreign sector profits fell at a deeper 22.8% rate (23.3% y/y).
An improved foreign trade deficit added a
little-revised 2.9 percentage points to GDP growth. That was the
largest addition since the third quarter of 1980. Exports grew at a
12.3% annual rate (11.0% y/y) while growth in imports fell about as
estimated earlier at a 7.3% (-1.9% y/y) rate. That was the steepest
quarterly rate of decline since the recession year of 2001.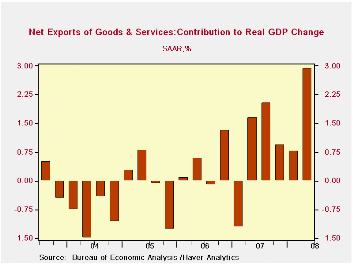
Inventory decumulation reduced 2Q GDP growth by a little changed 1.5 percentage points, still the largest subtraction in three years.
The GDP chain price index was little revised and grew at a 1.1% rate. The small increase was due to a 3.5% (-1.5% y/y) rate of decline in residential investment prices. That was the fourth decline in the last five quarters. The PCE price index grew at an unrevised, accelerated 4.3% (3.7% y/y) rate. Capital spending prices rose at an accelerated 2.3% rate (1.0% y/y).
| Chained 2000$, % AR | 2Q '08 (Final) | 2Q '08 (Preliminary) | 2Q '08 (Advance) | 1Q '08 | 2Q Y/Y | 2007 | 2006 | 2005 |
|---|---|---|---|---|---|---|---|---|
| GDP | 2.8 | 3.3 | 1.9 | 0.9 | 2.1 | 2.0 | 2.8 | 2.9 |
| Inventory Effect | -1.4 | -1.4 | -1.9 | -0.0 | -0.4 | -0.4 | 0.0 | -0.2 |
| Final Sales | 4.4 | 4.8 | 3.9 | 0.9 | 2.5 | 2.4 | 2.8 | 3.1 |
| Foreign Trade Effect | 2.9 | 3.1 | 2.4 | 0.8 | 1.7 | 0.6 | 0.2 | 0.0 |
| Domestic Final Demand | 1.3 | 1.5 | 1.3 | 0.1 | 0.8 | 1.8 | 2.6 | 3.1 |
| Chained GDP Price Index | 1.1 | 1.2 | 1.1 | 2.6 | 2.0 | 2.7 | 3.2 | 3.3 |
by Tom Moeller September 26, 2008
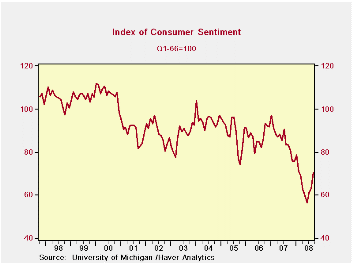
The University of Michigan's reading of consumer sentiment in September jumped 11.6% though the gain was less than the 16.0% pop in the mid-month report. It still was the highest level since February and the gain to 70.3 contrasted with Consensus expectations for a reading of 70.0.
During the last ten years there has been a 47% correlation between the level of sentiment and the three-month change in real consumer spending.
The mean expected rate of inflation during the next year
dropped to 4.6% with lower oil prices, though that was higher than a
3.9% expectation at mid-month. It was as high as 7.0% in May. During
the next five years the expected inflation rate fell to 3.3%, the
lowest level since mid-2005.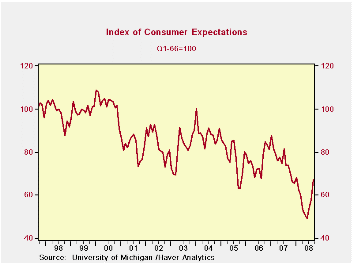
The expectations component of consumer sentiment led the increase in the total with a 16.1% jump, but the rise still left the reading down slightly from one-year ago. Expectations for business conditions during the next year jumped yet they remained lower than last year. Expectations for conditions during the next five years rose firmly to their highest since February.The expected change in personal finances also recovered to the highest level in one year.
The current conditions index rose a moderate 5.6% for the month to the highest level since April. The view of current personal finances rose to their highest level since April but the sense of buying conditions for large household goods fell m/m, down 25.7% y/y.
The opinion of government policy, which apparently influences economic expectations, rose slightly from August (-26.6% y/y). Only seven percent of respondents thought that a good job was being done by government, an unchanged reading since April.
The University of Michigan survey is not seasonally adjusted.The reading is based on telephone interviews with about 500 households at month-end; the mid-month results are based on about 300 interviews. The summary indexes are in Haver's USECON database, with details in the proprietary UMSCA database.
| University of Michigan | September | Mid-September | August | Sept. y/y | 2007 | 2006 | 2005 |
|---|---|---|---|---|---|---|---|
| Consumer Sentiment | 70.3 | 73.1 | 63.0 | -15.7% | 85.6 | 87.3 | 88.5 |
| Current Conditions | 75.0 | 76.5 | 71.0 | -23.4 | 101.2 | 105.1 | 105.9 |
| Expectations | 67.2 | 70.9 | 57.9 | -9.3 | 75.6 | 75.9 | 77.4 |
by Robert Brusca September 26, 2008
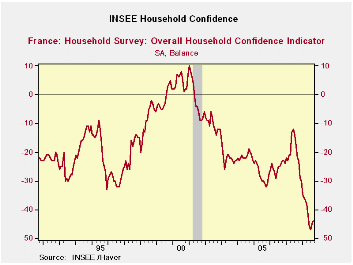
The small rise in French consumer sentiment comes as Q2 GDP is revised to show a larger drop amid weakness across other Euro Area countries. The rise in sentiment is somewhat like the improvement in US consumer sentiment in September. Energy prices moved lower for a spell and consumers usually react strongly to changes in energy prices. But energy costs have since moved higher. The overall French index stand in the lower five percent of its historic range. Survey respondents say over the past 12 months their living standards were in the bottom 2% compared to historic responses. For the next 12 months they expect an improvement with responses that are in the bottom 10 percentile of their historic range.
The spending environment is not very favorable for major purchases with a rating only in the lower 8 percent of its historic range or a ranking that is 221st out of a possible 225.
Putting range percentiles aside over this period there are 225 months of observations. Seven of the key measures rank 221 or worse. That is by ranking the readings we find they reside in the bottom two percent among all observations (see table to identify those categories).
The bounce in the French household confidence reading is not significant. It will have to show it can weather more storms ahead instead of just react well when global oil prices fall.
| INSEE Household Monthly Survey | ||||||||||
|---|---|---|---|---|---|---|---|---|---|---|
| Since Jan 1990 | Since Jan 1990 | |||||||||
| Sep 08 |
Aug 08 |
Ju 08 |
Jun 08 |
%tile | Rank | Max | Min | Range | Mean | |
| Household Confidence | -44 | -45 | -47 | -46 | 5.3 | 222 | 10 | -47 | 57 | -18 |
| Living Standards | ||||||||||
| past 12 Mos | -80 | -80 | -82 | -78 | 2.0 | 223 | 18 | -82 | 100 | -38 |
| Next 12-Mos | -51 | -54 | -59 | -57 | 10.8 | 222 | 15 | -59 | 74 | -19 |
| Unemployment: Next 12 | 51 | 43 | 36 | 21 | 80.0 | 60 | 73 | -37 | 110 | 29 |
| Price Developments | ||||||||||
| Past 12Mo | 44 | 54 | 61 | 63 | 83.5 | 7 | 64 | -57 | 121 | -16 |
| Next 12-Mos | -54 | -42 | -30 | -29 | 6.6 | 223 | 31 | -60 | 91 | -34 |
| Savings | ||||||||||
| Favorable to save | 17 | 18 | 18 | 20 | 36.1 | 173 | 40 | 4 | 36 | 23 |
| Ability to save Next 12 | -16 | -18 | -20 | -21 | 24.1 | 198 | 6 | -23 | 29 | -9 |
| Spending | ||||||||||
| Favorable for major purchase | -37 | -38 | -38 | -37 | 8.6 | 221 | 16 | -42 | 58 | -13 |
| Financial Situation | ||||||||||
| Current | 8 | 7 | 7 | 8 | 23.8 | 172 | 24 | 3 | 21 | 12 |
| Past 12 MOs | -34 | -35 | -36 | -34 | 6.5 | 222 | -5 | -36 | 31 | -17 |
| Next 12-Mos | -18 | -20 | -21 | -23 | 14.7 | 221 | 11 | -23 | 34 | -1 |
| Number of observations in the period: 225 | ||||||||||
by Robert Brusca September 26, 2008
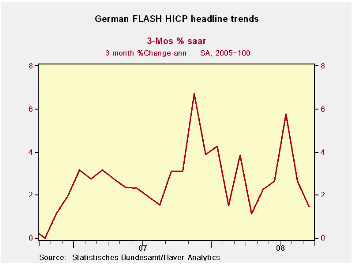
The chart on the left shows German inflation has been soaring and chopping around, then, recently it moved into a still-choppy but lower range. Headline inflation is and has been decelerating. But core inflation (only available thru August) is still accelerating. Of course oil prices broke lower in this period but have since moved higher, implying the headline rate’s improvement is still a bit suspect. Core inflation over 3 months and 6 months shows some tendency to accelerate but for both the German CPI definition as well as the HICP definition through August year/year core inflation is below the 2% ceiling that applies to the overall EMU HICP. That much is good news. But Germany is also one of the EMU’s best inflation-controlled economies and it barely skates under this barrier for core inflation so we can expect that the news and trends for all of EMU are worse.
Energy prices continue to muck-up the inflation picture. Past energy increases still elevate the 12-month headline rate to a pace that makes the ECB somewhere between uncomfortable and embarrassed. Money growth and credit growth in EMU continue to be strong. Yet the growing US financial crisis and spreading economic weakness put the ECB on the spot when it comes to policy decisions. We suspect inflation is still the ECB’s dominant concern and wonder if it will be able to shift its focus fast enough to cushion the blow on growth that the overly strong euro and weakening global economies have in store for Europe.
| German HICP and CPI | |||||||
|---|---|---|---|---|---|---|---|
| Mo/Mo % | Saar % | Yr/Yr | |||||
| Sep-07 | Aug-07 | Jul-07 | 3-Mo | 6-Mo | 12-Mo | Yr Ago | |
| HICP Total | 0.2% | -0.2% | 0.4% | 1.5% | 2.1% | 3.0% | 2.6% |
| Core | #N/A | 0.3% | 0.3% | 2.7% | 1.7% | 1.9% | 2.3% |
| CPI | |||||||
| All | 0.2% | -0.2% | 0.3% | 1.1% | 2.3% | 2.9% | 2.7% |
| CPI ex Food & Energy | #N/A | 0.2% | 0.2% | 2.3% | 1.5% | 1.8% | 2.3% |
| Food | #N/A | 0.4% | 0.9% | 5.5% | 4.6% | 7.0% | 3.2% |
| Alcohol | #N/A | 0.3% | -0.5% | -1.8% | 0.5% | 4.1% | 2.7% |
| Clothing & Shoes | #N/A | 1.4% | -1.1% | 1.2% | -1.4% | 1.4% | 1.7% |
| Rent & Utilities | #N/A | -0.2% | 0.4% | 2.6% | 4.0% | 3.9% | 1.6% |
| Health Care | #N/A | 0.1% | 0.2% | 3.2% | 2.4% | 1.8% | 1.2% |
| Transport | #N/A | -1.3% | 0.2% | -1.1% | 2.9% | 4.7% | 2.3% |
| Communication | #N/A | -0.4% | 0.1% | -3.9% | -3.6% | -3.6% | -1.0% |
| Recreation & Culture | #N/A | -0.1% | 0.9% | 3.3% | 1.4% | 0.4% | 0.5% |
| Education | #N/A | -1.1% | 1.0% | -1.7% | -6.2% | 3.4% | 31.4% |
| Restaurant & Hotel | #N/A | 0.5% | 0.3% | 3.4% | 2.7% | 2.3% | 3.0% |
| Other | #N/A | 0.0% | 0.1% | 1.1% | 1.5% | 1.8% | 2.9% |
| Diffusion | 45.5% | 36.4% | 36.4% | ||||
| Type: | Diffusion: Current Compared to | 6-mo | 12-mo | Yr-Ago | -- | ||
| Shaded regions are lagged by one month due to missing month current observations | |||||||

Tom Moeller
AuthorMore in Author Profile »Prior to joining Haver Analytics in 2000, Mr. Moeller worked as the Economist at Chancellor Capital Management from 1985 to 1999. There, he developed comprehensive economic forecasts and interpreted economic data for equity and fixed income portfolio managers. Also at Chancellor, Mr. Moeller worked as an equity analyst and was responsible for researching and rating companies in the economically sensitive automobile and housing industries for investment in Chancellor’s equity portfolio. Prior to joining Chancellor, Mr. Moeller was an Economist at Citibank from 1979 to 1984. He also analyzed pricing behavior in the metals industry for the Council on Wage and Price Stability in Washington, D.C. In 1999, Mr. Moeller received the award for most accurate forecast from the Forecasters' Club of New York. From 1990 to 1992 he was President of the New York Association for Business Economists. Mr. Moeller earned an M.B.A. in Finance from Fordham University, where he graduated in 1987. He holds a Bachelor of Arts in Economics from George Washington University.
More Economy in Brief


