 Global| Jul 31 2008
U.S. 2Q'08 GDP Growth Improved Due to Foreign Trade
by:Tom Moeller
|in:Economy in Brief
Summary
U.S. real GDP growth last quarter improved to 1.9% from 0.9% during 1Q and from the small decline (revised from a slight increase) during 4Q'07. In addition, growth last year and during 2006 was revised down by 0.2 percentage points [...]
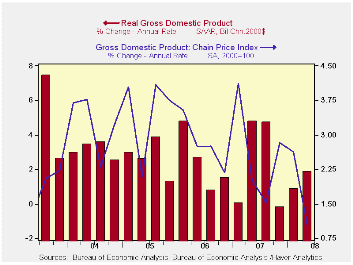
U.S. real GDP growth last quarter improved to 1.9% from 0.9% during 1Q and from the small decline (revised from a slight increase) during 4Q'07. In addition, growth last year and during 2006 was revised down by 0.2 percentage points to 2.0% and 2.8%. Growth last quarter fell short of Consensus expectations for a 2.2% rate of increase.
Corporate profits were not available for 2Q but the rate of change during 1Q was revised down to -4.3% (-1.5% y/y) from -1.3%.
An improved foreign trade deficit added 2.4 percentage points to GDP growth. That was the largest addition since the third quarter of 1980. Exports grew at a strong 9.2% annual rate. The 10.2% y/y growth rate matched that of the prior three quarters. Growth in imports was negative for the third consecutive quarter at -6.6% (-1.7% y/y) and that was the steepest quarterly rate of decline since the recession year of 2001.
Inventory decumulation offset much of the addition from trade and reduced 2Q GDP growth by 1.9 percentage points. That was the largest subtraction in three years.
Growth in final sales to domestic purchasers
improved to a still moderate 1.3% from an unrevised 0.1% during 1Q. The
y/y growth rate of 0.8% was the weakest since late
in 1991.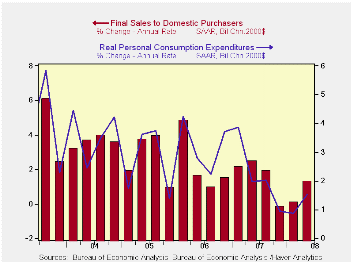
Residential construction continued to weigh on domestic demand as it fell at a 15.6% annual rate (-22.2% y/y). That decline subtracted 0.6 percentage points from 2Q GDP growth after single percentage point subtractions during the prior two quarters.
Growth in real personal consumption improved modestly, perhaps due to the issuance of income tax rebate checks, to 1.5% (1.3% y/y) from 0.9% growth during 1Q. Spending on autos & light trucks fell at an 18.5% (-9.4% y/y) annual rate but spending on furniture & other household equipment surged at a 13.4% (6.9% y/y) rate. Spending on apparel rose at a 10.3% (3.5% y/y) rate but spending on recreation rose only at a 0.8% (-0.5% y/y) rate. Growth in real PCE added 1.1 percentage points to 2Q real GDP growth after a 0.6% add during 1Q.
Growth in business fixed investment held steady with 1Q at a 2.3% rate (4.2% y/y). These latest rates of growth are down sharply from 4.9% increases last year and growth above 7.0% during 2006 and 2005. Last quarter, equipment investment fell at a 3.4% (0.1% y/y) rate while structures investment jumped at a 14.3% (12.9% y/y) rate.
The GDP chain price index grew at a 1.1% rate which was less than half the Consensus expectation for a 2.6% rise. The small increase was due to a 2.2% rate of decline in residential investment prices. The PCE price index grew at an accelerated 4.2% (3.7% y/y) rate.
| Chained 2000$, % AR | 2Q '08 | 1Q '08 | 4Q '07 | 2Q Y/Y | 2007 | 2006 | 2005 |
|---|---|---|---|---|---|---|---|
| GDP | 1.9 | 0.9 | -0.2 | 1.8 | 2.0 | 2.8 | 2.9 |
| Inventory Effect | -1.9 | -0.0 | -1.0 | -0.6 | -0.4 | 0.0 | -0.2 |
| Final Sales | 3.9 | 0.9 | 0.8 | 2.4 | 2.4 | 2.8 | 3.1 |
| Foreign Trade Effect | 2.4 | 0.8 | 0.9 | 1.6 | 0.6 | 0.2 | 0.0 |
| Domestic Final Demand | 1.3 | 0.1 | -0.1 | 0.8 | 1.8 | 2.6 | 3.1 |
| Chained GDP Price Index | 1.1 | 2.6 | 2.8 | 2.0 | 2.7 | 3.2 | 3.3 |
by Tom Moeller July 31, 2008
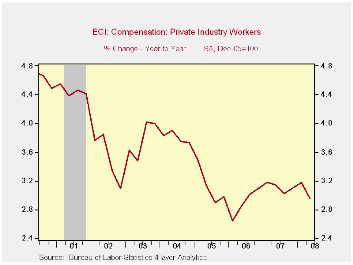
The employment cost index for private industry workers increased by 0.6% last quarter and that was the weakest rate of gain since 1Q 2006. It fell short of Consensus expectations for a 0.7% rise. The rise held roughly steady the y/y growth in compensation at 3.0% which was steady with the gains of the last three years.
During the last twenty years there has been a 54% correlation
between the growth in employee compensation and the rise in the PCE
price index. That level of correlation goes neither up or down, when
either series is led or lagged the other. This suggests a self
reinforcing effect between the two series.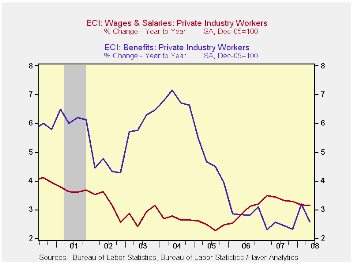
Wage and salary growth dipped slightly to 0.7% versus 0.8% increases during the prior four quarters. Wages account for roughly 70% of the compensation index. Wages in the services industries grew a steady 0.7% (3.1% y/y) while wages in the goods producing industries grew 0.6% (3.1% y/y) after the 1.0% pop during 1Q.
The rise in benefit costs slowed further to 0.5%. Year-to-year, the 2.6% rise in benefit costs in the service producing industries was roughly steady with the prior two years but down sharply from 4-6% growth back to 2000. In the goods producing sector benefits rose 0.3% (2.2% y/y).
Health benefit costs rose a somewhat reduced 4.6% y/y.
The Fed's announcement of steps to enhance the effectiveness of its existing liquidity facilities can be found here.
| ECI - Private Industry Workers | 2Q '08 | 1Q '08 | 4Q '07 | 2Q Y/Y | 2007 | 2006 | 2005 |
|---|---|---|---|---|---|---|---|
| Compensation | 0.6% | 0.8% | 0.9% | 3.0% | 3.1% | 2.9% | 3.1% |
| Wages & Salaries | 0.7% | 0.8% | 0.8% | 3.1% | 3.4% | 2.9% | 2.5% |
| Benefit Costs | 0.5% | 0.6% | 0.8% | 2.6% | 2.4% | 2.9% | 4.6% |
by Tom Moeller July 31, 2008
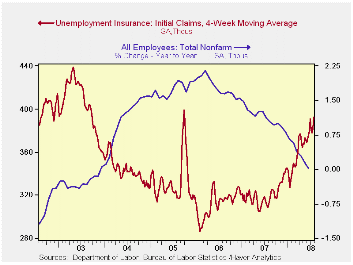
Initial claims for unemployment insurance surged last week to 448,000 from 404,000 during the prior week. The latest level was the highest in five years but it may have been upwardly biased by summer workers. The weekly level surpassed Consensus expectations for 390,000 claims.
As a result of the latest jump in initial claims, the
four-week moving average increased to 393,000 (27.4% y/y). During June
claims averaged 391,000.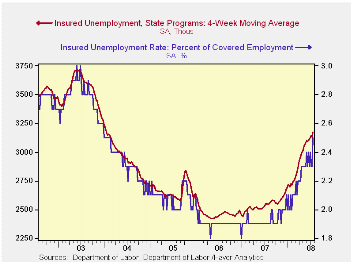
A claims level below 400,000 typically has been associated with growth in nonfarm payrolls. During the last ten years there has been a (negative) 76% correlation between the level of initial claims and the m/m change in nonfarm payroll employment. Over the longer period of time, the level of claims for jobless insurance has not trended higher with the size of the labor force due to a higher proportion of self-employed workers who are not eligible for benefits.
Continuing claims for unemployment insurance during the latest week jumped 185,000 after declines during the prior two weeks. The four-week moving average of continuing claims rose and reached the highest level since early 2004.
Continuing claims provide some indication of workers' ability to find employment and they lag the initial claims figures by one week.
The insured rate of unemployment rose to 2.5% from 2.3%. The latest was the highest level since early 2004.
| Unemployment Insurance (000s) | 07/26/08 | 07/19/08 | Y/Y | 2007 | 2006 | 2005 |
|---|---|---|---|---|---|---|
| Initial Claims | 448 | 404 | 43.1% | 322 | 313 | 331 |
| Continuing Claims | -- | 3,282 | 29.1% | 2,552 | 2,459 | 2,662 |
by Tom Moeller July 31, 2008
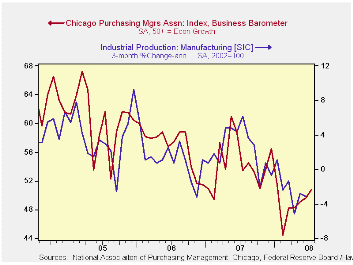
The Chicago Purchasing Manager's Association reported that its July business barometer improved again. The figure of 50.8, versus 49.6 in June, was the first reading above the break-even level of 50 since this past January. Consensus expectations had been for an unchanged reading of 49.0.
During the last ten years there has been a 67% correlation
between the business barometer and the three-month change in US factory
sector industrial production. There has been an 85% correlation between
the Chicago figure and the national ISM index (due for release
tomorrow) and that is the highest correlation of all the regional
series with the national ISM index.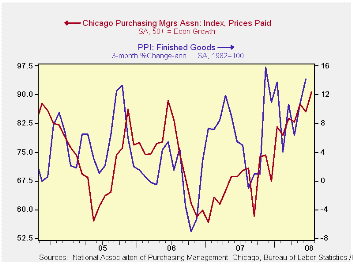
Most of the components of the overall index improved in July. By far the largest came from the inventory series which rose sharply. The employment index, however, slipped after sharp improvement in June.
The production and new orders components inched up m/m and remained above the recent lows.
The prices paid index surged to its highest level since early 1980. During the last ten years there has been a 48% correlation between the price index and the three-month change in the finished goods PPI.
House Prices and the Stance of Monetary Policy from the Federal Reserve Bank of St. Louis is available here.
| Chicago PMI | July | June | July '07 | 2007 | 2006 | 2005 |
|---|---|---|---|---|---|---|
| Chicago PMI Business Barometer Index | 50.8 | 49.6 | 53.2 | 54.4 | 56.8 | 60.4 |
by Tom Moeller July 31, 2008
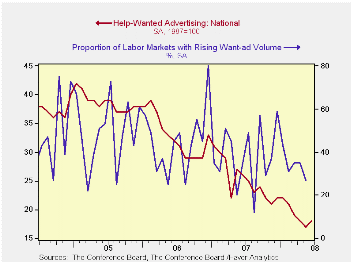
The index of help-wanted advertising, reported by the Conference Board, ticked up last month to 18 from 17 in May. Both levels were, however, still at or near the record lows for the two series.
During the last ten years there has been a 57% correlation between the level of help-wanted advertising and the three-month change in non-farm payrolls.
Each region of the country held steady with the May level except the West South Central and the West North Central where the indexes rose slightly.
The Conference Board surveys help-wanted print advertising volume in 51 major newspapers across the country every month. The latest help wanted report from the Conference Board is available here.
In 2006, the Conference Board introduced its Help Wanted Online Data Series and the latest release can be found in this link.
Economic Projections and Rules of Thumb for Monetary Policy from the Federal Reserve Bank of St. Louis can be found here.
| Conference Board | June | May | June 2007 | 2007 | 2006 | 2005 |
|---|---|---|---|---|---|---|
| National Help Wanted Index | 18 | 17 | 26 | 26 | 33 | 39 |
by Robert Brusca July 31, 2008
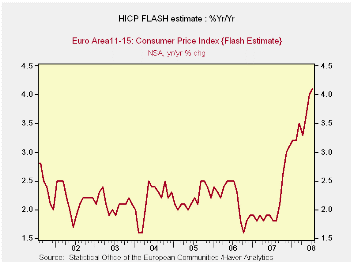
The EMU HICP did slow from its m/m pace of last month but the headline is still moving higher. The 12-mo to 6-mo to 3-mo growth rates how that the speed of the rise is accelerating. German price trends are up-to-date and they show the same steady accelerating as for the EMU headline. Italy also with inflation updated for July shows the pace steady at just above 4% across theses same horizons.
We have no details to look at yet in the HICP. But as of last month goods prices (oil and food) were carrying trends higher whiles services prices remained subdued. At a 2.2% over three months services sector inflation actually stepped down in the last three months compared to 6-mos and 12-mos.
Through June month Core inflation was relatively well behaved at 1.3% over three months for all of EMU but still an unruly 2.5% Yr/Yr. German core inflation through June reached only 1.8% Yr/Yr and shorter time spans show it has been decelerating. Italian and Spanish Core inflation rates are above 2% for 12 months but in each case inflation has fallen over shorter horizons. For Italy core 3-Mo inflation is running at a pace below 2%; for Spain it is a slightly excessive 2.2%.
The news that the ECB says it watches the most closely is the worst (headline inflation). But the core shows some progress even if its 12-mo growth rate remains something to give the ECB pause.
| Trends in EMU HICP; Flash Index | |||||||
|---|---|---|---|---|---|---|---|
| % mo/mo | % saar | ||||||
| Jul-08 | Jun-08 | May-08 | 3-Mo | 6-Mo | 12-Mo | Yr Ago | |
| EMU-13 | 0.2% | 0.5% | 0.6% | 5.1% | 4.0% | 4.1% | 1.8% |
| Core | #N/A | 0.2% | 0.2% | 1.3% | 2.3% | 2.5% | 1.9% |
| Goods | #N/A | 0.4% | 0.8% | 7.6% | 6.0% | 4.9% | 1.5% |
| Services | #N/A | 0.3% | 0.4% | 2.2% | 2.5% | 2.5% | 2.6% |
| HICP | |||||||
| Germany | 0.3% | 0.5% | 0.6% | 5.4% | 3.2% | 3.5% | 2.0% |
| France | #N/A | 0.5% | 0.5% | 4.5% | 4.0% | 4.0% | 1.3% |
| Italy | 0.0% | 0.6% | 0.4% | 4.2% | 4.4% | 4.1% | 1.7% |
| Spain | #N/A | 0.6% | 0.7% | 4.9% | 4.5% | 5.0% | 2.4% |
| Core excl Food Energy & Alcohol | |||||||
| Germany | #N/A | 0.1% | 0.3% | -0.4% | 0.8% | 1.8% | 2.1% |
| France | #N/A | #N/A | 0.1% | #N/A | #N/A | #N/A | 1.4% |
| Italy | #N/A | 0.4% | 0.2% | 1.9% | 3.1% | 3.0% | 1.9% |
| Spain | #N/A | 0.3% | 0.3% | 2.2% | 2.6% | 3.4% | 2.5% |
| Blue shaded area data trail by one month | |||||||

Tom Moeller
AuthorMore in Author Profile »Prior to joining Haver Analytics in 2000, Mr. Moeller worked as the Economist at Chancellor Capital Management from 1985 to 1999. There, he developed comprehensive economic forecasts and interpreted economic data for equity and fixed income portfolio managers. Also at Chancellor, Mr. Moeller worked as an equity analyst and was responsible for researching and rating companies in the economically sensitive automobile and housing industries for investment in Chancellor’s equity portfolio. Prior to joining Chancellor, Mr. Moeller was an Economist at Citibank from 1979 to 1984. He also analyzed pricing behavior in the metals industry for the Council on Wage and Price Stability in Washington, D.C. In 1999, Mr. Moeller received the award for most accurate forecast from the Forecasters' Club of New York. From 1990 to 1992 he was President of the New York Association for Business Economists. Mr. Moeller earned an M.B.A. in Finance from Fordham University, where he graduated in 1987. He holds a Bachelor of Arts in Economics from George Washington University.
More Economy in Brief


