 Global| May 29 2009
U.S. 1Q GDP Decline Lessened, YetTwo-Quarter Drop Rivals 1958 Stats; Profits Recovered Modestly
by:Tom Moeller
|in:Economy in Brief
Summary
Last quarter, economic weakness in the U.S. was not quite as severe as reported initially by the Commerce Department. The latest estimate of a 5.7% (AR) drop in real GDP compares to the advance estimate of a 6.1% decline and the [...]
 Last quarter, economic weakness in the U.S. was not quite as
severe as reported initially by the Commerce Department. The latest
estimate of a 5.7% (AR) drop in real GDP compares to the advance
estimate of a 6.1% decline and the revision about matched Consensus
expectations. Nevertheless, combined with the 6.3% drop during 4Q '08
the GDP declines were still the worst since early-1958.
Last quarter, economic weakness in the U.S. was not quite as
severe as reported initially by the Commerce Department. The latest
estimate of a 5.7% (AR) drop in real GDP compares to the advance
estimate of a 6.1% decline and the revision about matched Consensus
expectations. Nevertheless, combined with the 6.3% drop during 4Q '08
the GDP declines were still the worst since early-1958.
As the financial sector recovered from its fourth quarter
swoon, it lifted the overall measure of corporate profitability. Total
corporate profits rose 3.4% (-18.0% y/y) last quarter due to a
near-doubling (-41.5% y/y) of financial sector earnings. That recovery
followed declines in the financial sector during the prior three
quarters which had dropped them to nearly one-quarter of the level at
the start of 2008.  Earnings in the nonfinancial sector countered that
1Q rise with an 8.6% decline (-13.4% y/y) which about matched the 4Q
shortfall. Earnings in the foreign sector continued down by 2.3% (-3.0%
y/y) as recessions abroad deepened.
Earnings in the nonfinancial sector countered that
1Q rise with an 8.6% decline (-13.4% y/y) which about matched the 4Q
shortfall. Earnings in the foreign sector continued down by 2.3% (-3.0%
y/y) as recessions abroad deepened.
The cutback of unwanted levels of inventories still is estimated to have subtracted significantly from GDP growth last quarter, but the estimate was lessened to 2.3 percentage points from 2.8 points. Regardless, the subtraction was the most since the first quarter of 2000 and it rivals the largest negative contribution from inventories since the early-1980s.
 Unwanted inventory levels were reduced following the drop-off
in real U.S. final sales to domestic purchasers. They fell at a 5.3%
rate which was revised slightly from the earlier estimate of a 5.1%
decline. Combined with the 4Q '08 decline, final sales to domestic
purchasers fell the most since 1958.
Unwanted inventory levels were reduced following the drop-off
in real U.S. final sales to domestic purchasers. They fell at a 5.3%
rate which was revised slightly from the earlier estimate of a 5.1%
decline. Combined with the 4Q '08 decline, final sales to domestic
purchasers fell the most since 1958.
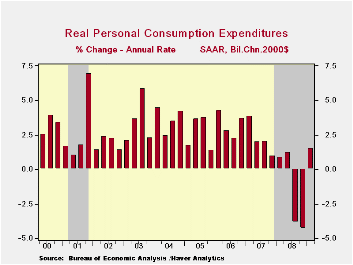
The rise in personal consumption expenditures last quarter was lessened to 1.6% (-1.4% y/y) from the initial estimate of a 2.2% increase. This modest increase followed sharp declines during the prior two quarters. Spending on motor vehicles rose moderately during the quarter (-18.7% y/y) after five consecutive down periods. Business fixed investment fell at a 36.9% rate (-16.0% y/y) and residential investment dropped at a 38.7% rate (-23.4% y/y) from 4Q. Both of these declines were significantly deeper than reported initially.
U.S. Household Deleveraging and Future Consumption Growth from the Federal Reserve Bank of San Francisco is available here.
The significant shortfall in expenditures by the government sector still accounts for much of last quarter's weakness in GDP. It was little revised at -3.5% and was the first decline since late-2005. The drop was led by a surprising 4.3% decline (+5.5% y/y) in Federal spending that was paced by a 6.7% decline (+5.1% y/y) in defense expenditures. State & local spending also fell at a 3.0% annual rate (-0.3% y/y).
The foreign trade sector made up for some of the economy's weakness as net exports contributed a little-revised 2.2 percentage points to 1Q GDP growth. Imports fell at a 34.1% annual rate (-16.5% y/y) while recessions abroad pulled U.S. exports down at a lesser 28.7% rate (-10.9% y/y).
Inflation continued to show signs of firming. The little revised 2.8% increase in the GDP chain price index was up from the 0.5% annual rate of increase during 4Q. The reason for the acceleration is that import prices fell at a faster rate than export prices. Domestic prices, however, reflected the weak economy. The PCE price index fell at a 1.0% annual rate (+0.8% y/y) while the residential investment chain price index fell at a 4.6% rate (-5.2% y/y). The weakness in business spending caused the nonresidential investment price index also to slip at a 1.2% rate (+2.4% y/y), the first quarterly decline since 2007. Overall, domestic prices fell at a 1.0% annual rate (+0.8% y/y) after a 4.3% 4Q decline.
The U.S. National Income & Product Account data is available in Haver's USECON and the USNA databases.
The Fed's Monetary Policy Response to the Current Crisis from the Federal Reserve Bank of San Francisco can be found here.
| Chained 2000$, % AR | 1Q '09 (Preliminary) | 1Q '09 (Advance) | 4Q '08 | 1Q Y/Y | 2008 | 2007 | 2006 |
|---|---|---|---|---|---|---|---|
| GDP | -5.7 | -6.1 | -6.3 | -2.5 | 1.1 | 2.0 | 2.8 |
| Inventory Effect | -2.3 | -2.8 | -0.1 | -0.8 | 0.1 | -0.4 | 0.0 |
| Final Sales | -3.4 | -3.4 | -6.2 | -1.7 | 1.4 | 2.4 | 2.8 |
| Foreign Trade Effect | 2.2 | 2.0 | -0.2 | -1.4 | 1.4 | 0.6 | 0.2 |
| Domestic Final Demand | -5.3 | -5.1 | -5.8 | -3.1 | -0.0 | 1.8 | 2.6 |
| Chained GDP Price Index | 2.8 | 2.9 | 0.5 | 2.1 | 2.2 | 2.7 | 3.2 |
by Robert Brusca May 28, 2009

Retail sales are falling on a Yr/Yr basis but, in recent
months, spending has been higher; over three months spending (ex-autos)
is actually rising. As we saw in the first quarter German GDP report,
consumers have been mildly affected by the German downturn but the real
weakness has been in the industrial measures such as business
investment, exports plus in housing. Find that retail sales are holding
up is a good sign that the German recession is not spreading and that
its social welfare support system is holding together the ability of
consumers to participate in the economy.
German consumption figures are somewhat encouraging. Still the
German consumer is not likely to be an engine of growth. Consumption is
a core part of GDP that is stabilizing and that is an important
contribution. The industrial weakness is still present and remains a
threat, But that depends on demand elsewhere since the threatening
weakness is to German investment goods output and exports. Exports
remain weak.
| German Real and Nominal Retail Sales | QTR | |||||||
|---|---|---|---|---|---|---|---|---|
| Nominal | Apr-09 | Mar-09 | Feb-09 | 3-MO | 6-MO | 12-MO | YrAgo | Saar |
| Retail Ex auto | 0.9% | -0.6% | 0.2% | 2.0% | -2.7% | -0.4% | -1.6% | 3.5% |
| Real | ||||||||
| Retail Ex auto | 0.5% | -0.4% | 0.0% | 0.4% | -1.5% | -0.3% | -4.5% | 1.5% |
by Tom Moeller May 29, 2009
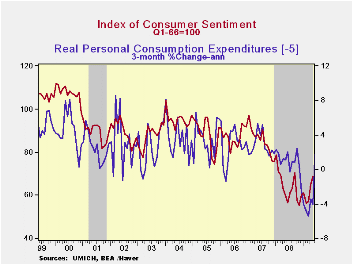
The University of Michigan's reading of consumer sentiment for all of May rose to the highest level since September of last year. At 68.7 the latest level was up from the mid-month figure and slightly exceeded Consensus expectations for a reading of 68.0. The increase bodes well for the consumer spending outlook because during the last ten years, there has been a 61% correlation between the level of sentiment and the growth in real spending during the next five months.
The expectations component of consumer sentiment, which had been improving, jumped another 10.0% m/m to its highest level since late-2007. The gain was fueled by improved expectations for business conditions during the next year which jumped also to the highest level since 2007. Expected conditions during the next year surged by a similar degree. Unlike last month, however, the higher stock market failed to lift the expected change in personal finances which dipped slightly m/m but were up significantly y/y.
The opinion of government policy, which may eventually influence economic expectations, jumped sharply to the highest level since 2002. Thirty percent of respondents thought that a good job was being done by government, up from the four percent low of last December, while a much reduced 22 percent of respondents thought that a poor job was being done.
The current economic conditions index stuttered, but just
slightly, as the reading for current personal finances dipped. The drop
was offset, however, by an improved read of current conditions for
buying large household goods to the highest level since last August.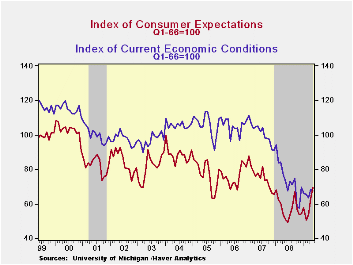
Inflation expectations for the next year rose to 3.2%. That compares to a low of 1.7% last December but remained down from a reading which was as high as 7.0% last May.
The University of Michigan survey data is not seasonally adjusted. The reading is based on telephone interviews with about 500 households at month-end; the mid-month results are based on about 300 interviews. The summary indexes are in Haver's USECON database with details in the proprietary UMSCA database.
| University of Michigan | May | Mid-May | April | March | May y/y | 2008 | 2007 | 2006 |
|---|---|---|---|---|---|---|---|---|
| Consumer Sentiment | 68.7 | 67.9 | 65.1 | 57.3 | 14.9% | 63.8 | 85.6 | 87.3 |
| Current Conditions | 67.7 | 66.2 | 68.3 | 63.3 | -7.6 | 73.7 | 101.2 | 105.1 |
| Expectations | 69.4 | 69.0 | 63.1 | 53.5 | 35.8 | 57.3 | 75.6 | 75.9 |

Tom Moeller
AuthorMore in Author Profile »Prior to joining Haver Analytics in 2000, Mr. Moeller worked as the Economist at Chancellor Capital Management from 1985 to 1999. There, he developed comprehensive economic forecasts and interpreted economic data for equity and fixed income portfolio managers. Also at Chancellor, Mr. Moeller worked as an equity analyst and was responsible for researching and rating companies in the economically sensitive automobile and housing industries for investment in Chancellor’s equity portfolio. Prior to joining Chancellor, Mr. Moeller was an Economist at Citibank from 1979 to 1984. He also analyzed pricing behavior in the metals industry for the Council on Wage and Price Stability in Washington, D.C. In 1999, Mr. Moeller received the award for most accurate forecast from the Forecasters' Club of New York. From 1990 to 1992 he was President of the New York Association for Business Economists. Mr. Moeller earned an M.B.A. in Finance from Fordham University, where he graduated in 1987. He holds a Bachelor of Arts in Economics from George Washington University.
More Economy in Brief


