 Global| May 29 2008
U.S. 1Q'08 GDP Revised Up Slightly, Profits Rose
by:Tom Moeller
|in:Economy in Brief
Summary
U.S. real GDP growth during 1Q'08 was revised slightly higher to 0.9%, as expected. The rise followed a 4Q '07 increase of 0.6% and, together, the figures still are the weakest since near the end of the recession year of 2001. [...]
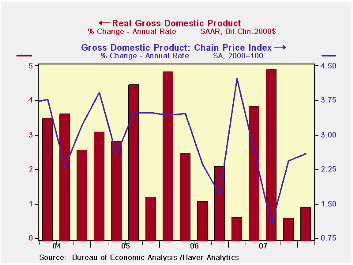
U.S. real GDP growth during 1Q'08 was revised slightly higher to 0.9%, as expected. The rise followed a 4Q '07 increase of 0.6% and, together, the figures still are the weakest since near the end of the recession year of 2001.
Corporate profits are estimated to have risen at a 1.3% (1.7% y/y) annual rate after declining at a 12.4% rate in 4Q and at a 4.9% rate in 3Q. Earnings in the financial sector continued lower at a 2.9% (-12.2% y/y) rate following declines of 48.3% in 4Q and -22.7% in 3Q. U.S. nonfinancial sector earnings rose all of 1.7% (-2.6% y/y) but that gain also followed two quarters of sharp declines. The gain in foreign sector earnings slowed considerably to a 5.1% (34.9% y/y) rate after outsized increases during each of the prior five quarters.
In the GDP accounts, revisions to trade and inventories offset
one another in their effect on 1Q GDP growth. An improved foreign
trade deficit added 0.8 percentage points to growth, up from
the earlier estimate of a 0.2 percentage point addition, though growth
in exports was lowered to 2.8% (8.8% y/y) from 5.5%. Imports are now
estimated to have declined at a 2.6% rate (-0.6% y/y) instead of rising
2.5%.
Inventory accumulation is now estimated to have added 0.2 percentage points to 1Q GDP growth, down from the last reading of a 0.8 point addition.
Most of the 1Q weakness in final sales to domestic purchasers was preserved. They now are estimated to have ticked down at a 0.1% rate versus the last estimate of -0.4% growth. These figures are still the first sub-zero readings since the earlier recession in 1991.
The decline in residential construction was still quite severe. Activity declined at a little revised 25.5% (-20.9% y/y) rate which was about equal to the drops in 4Q and 3Q. These are the quickest rates of decline since the recession in 1981 and the 1Q drop reduced overall real GDP growth by 1.2 percentage points.
Business fixed investment also fell at 0.3%
(+6.4% Y/Y) rate which was less than the 2.5% shortfall estimated
earlier. It still was the first negative growth, however, since 4Q'06
and the largest negative reading since early 2004. Overall it reduced
1Q GDP growth by less than 0.1 percentage points. Investment in
structures grew 1.1% (13.7% y/y) while equipment investment fell 0.9%
+3.3% y/y).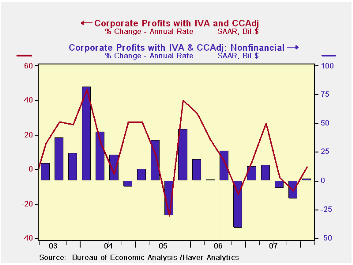
Growth in real personal consumption was unrevised at 1.0% (1.9% y/y) growth which was its weakest since the recession year of 2001. Spending on autos & light trucks fell at a 13.5% (-4.9% y/y) rate while spending on furniture & other household equipment ticked up at a quite weak 0.6% (4.9% y/y) rate. Spending of clothing rose 1.7% (1.6% y/y) and spending on services rose 3.0% (2.7% y/y). Growth in real PCE added 0.7 percentage point to 1Q real GDP growth and that was its weakest contribution since the recession of 2001.
The GDP chain price index was unrevised at a 2.6% annual rate which was its fastest gain in three quarters. The PCE price index rose at a 3.5% rate (3.4% y/y) which was down slightly from the 3.9% rise in 4Q. Less food & energy consumer prices rose at a 2.1% rate which was stable with growth during the prior four years. The price index for business fixed investment rose at a 0.2% rate and residential investment prices fell at a 2.3% (-0.9% y/y) rate which was the fastest rate of decline since 1970 (still not a typo).
| Chained 2000$, % AR | 1Q '08 (Preliminary) | 1Q '08 (Advance) | 4Q '07 | 3Q '07 | 1Q Y/Y | 2007 | 2006 | 2005 |
|---|---|---|---|---|---|---|---|---|
| GDP | 0.9 | 0.6 | 0.6 | 4.9 | 2.5 | 2.2 | 2.9 | 3.1 |
| Inventory Effect | 0.2 | 0.8 | -1.8 | 0.9 | 0.1 | -0.3 | 0.1 | -0.2 |
| Final Sales | 0.7 | -0.2 | 2.4 | 4.0 | 2.7 | 2.5 | 2.8 | 3.3 |
| Foreign Trade Effect | 0.8 | 0.2 | 1.0 | 1.4 | 1.0 | 0.7 | -0.1 | -0.2 |
| Domestic Final Demand | -0.1 | -0.4 | 1.3 | 2.5 | 1.4 | 1.8 | 2.7 | 3.3 |
| Chained GDP Price Index | 2.6 | 2.6 | 2.4 | 1.0 | 2.2 | 2.7 | 3.2 | 3.2 |
by Tom Moeller May 29, 2008
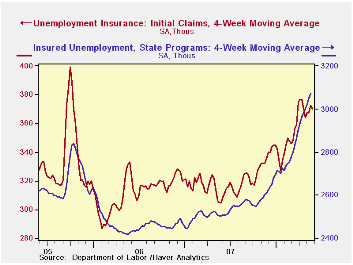
Last week initial claims for unemployment insurance again ticked up, by 4,000 to 372,000 following the prior week's 6,000 decline. Consensus expectations had been for claims to total 370,000 last week.
The four week moving average of initial claims fell slightly week-to-week to 370,500 (231.5% y/y). Claims averaged 364,000 during April.
A claims level below 400,000 typically has been associated with growth in nonfarm payrolls. During the last ten years there has been a (negative) 76% correlation between the level of initial claims and the m/m change in nonfarm payroll employment.
Continuing claims for unemployment insurance rose a large 36,000 after a 5,000 decline during the prior week. The latest level was the highest since March 2004. It provides some indication of workers' ability to find employment.
The continuing claims numbers lag the initial claims figures by one week.
The insured rate of unemployment held steady at 2.3% for the fifth week. That was the highest since 2004.
| Unemployment Insurance (000s) | 05/24/08 | 05/17/08 | Y/Y | 2007 | 2006 | 2005 |
|---|---|---|---|---|---|---|
| Initial Claims | 372 | 368 | 22.0% | 322 | 313 | 331 |
| Continuing Claims | -- | 3,104 | 24.9% | 2,552 | 2,459 | 2,662 |
by Tom Moeller May 29, 2008
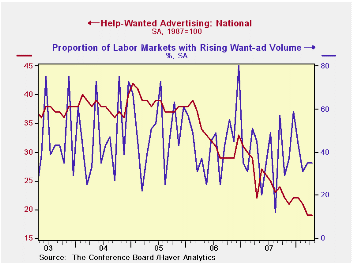
The index of help-wanted advertising reported by the Conference Board held last month at its record low of 19.
During the last ten years there has been a 57% correlation between the level of help-wanted advertising and the three month change in non-farm payrolls.
The proportion of labor markets with rising want-ads also held at its downwardly revised March level of 35%. The latest was improved from 12% in August of lat year which was the lowest monthly reading since October 2001.
Each region of the country held steady with the March level except the East South Central where the index fell.
The Conference Board surveys help-wanted print advertising volume in 51 major newspapers across the country every month. The latest help wanted report from the Conference Board is available here.
In 2006, the Conference Board introduced its Help Wanted Online Data Series and the latest release can be found in this link.
Regulation and the Neo-Wicksellian Approach to Monetary Policy from the Federal Reserve Bank of Dallas is available here.
| Conference Board | April | March | April 2007 | 2007 | 2006 | 2005 |
|---|---|---|---|---|---|---|
| National Help Wanted Index | 19 | 19 | 22 | 26 | 33 | 39 |
by Robert Brusca May 29, 2008
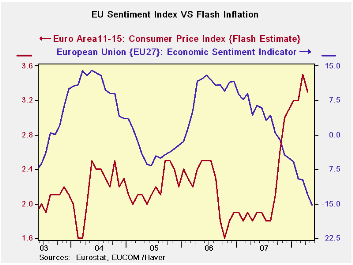
The EU overall sentiment reading fell to 96.7 in May from 98
in April. The EMU area’s overall index was unchanged in the month. For
the EU area, the industrial sector continues to be the relative
strongest. We gauge this NOT from the absolute index value for the
month but from its ranking for the month within its own range (see
percentile or rank column). The industrial sector has a raw reading of
-3 but a range percentile standing of 70.6 percent. In contrast the
services sector has a stronger looking +6 raw reading, but that reading
resides in the bottom 30 percentile of its range. Since sectors have
different intrinsic averages and volatility we view the percentiles as
a superior way to assess the readings across the various measures.
Comparisons to the mean also makes this clear since the service sector
mean is +16 compared to its current reading of +6 while for the
industrial sector the average reading is -7 and the current reading is
-3.
Retail and construction sectors are in moderately good shape
at the border of the top third of their respective ranges, consumer
confidence is quite weak residing in the 44th percentile of its range.
Country indices are uniformly lower, with Germany having the
relative best reading of this group in the 65th percentile of its range
followed by France in the 60th percentile of its range. Italy is in the
47th percentile of its range, even with the sharp jump in its sentiment
index this month. Spain is in the 25th percentile of its range and the
UK, a large EU (not EMU) member, stands in the 44th percentile of its
range.
The components readings: The EU/EMU region is still having
some difficulty. The EMU sentiment indicator stalled this month but the
EU measure continued to fall at a fairly rapid pace. The service sector
has been moving sideways for several months, while consumer sentiment,
having steadied in earlier months, fell sharply in May, amid some very
weak component readings. For industry, confidence has stayed aloft
while most components are showing decay. The production expectation
reading is the weakest relative component in the industrial sector
survey. Retailing shows encroaching weakness in employment expectations
and in orders placed. For services all of the main components are
around the bottom third of their respective ranges. Construction is a
relatively solid sector with firm component readings in the top third
of their respective ranges. While the industrial sector has the highest
range readings its components look weaker. Time will tell how ell
Europe holds up as the strong euro continues to take a toll along with
ebbing financial distress and a weakening global environment.
| EU Sectors and Country level Overall Sentiment | |||||||||||
|---|---|---|---|---|---|---|---|---|---|---|---|
| EU | May 08 |
Apr 08 |
Mar 08 |
Feb 08 |
%tile | Rank | Max | Min | Range | Mean | R-SQ w/ Overall |
| Overall | 96.7 | 98 | 101.9 | 100.3 | 54.7 | 132 | 116 | 73 | 43 | 100 | 1.00 |
| Industrial | -3 | -2 | 0 | 0 | 70.6 | 72 | 7 | -27 | 34 | -7 | 0.87 |
| Consumer Confidence | -14 | -12 | -11 | -11 | 44.8 | 149 | 2 | -27 | 29 | -10 | 0.83 |
| Retail | -3 | -6 | 1 | 1 | 66.7 | 48 | 6 | -21 | 27 | -6 | 0.47 |
| Construction | -12 | -11 | -9 | -7 | 66.7 | 83 | 3 | -42 | 45 | -17 | 0.42 |
| Services | 6 | 6 | 11 | 6 | 31.6 | 104 | 32 | -6 | 38 | 16 | 0.81 |
| % m/m | May 08 |
Based
on Level |
Level | ||||||||
| EMU | 0.0% | -2.5% | -0.6% | 97.1 | 54.6 | 123 | 117 | 73 | 44 | 99 | 0.95 |
| Germany | 0.2% | -1.2% | 0.3% | 103.0 | 65.1 | 83 | 116 | 79 | 37 | 99 | 0.73 |
| France | -3.2% | -2.4% | 0.0% | 99.8 | 60.0 | 120 | 119 | 72 | 47 | 100 | 0.79 |
| Italy | 3.3% | -1.7% | -1.3% | 95.1 | 47.6 | 144 | 121 | 71 | 50 | 100 | 0.79 |
| Spain | -1.1% | -3.8% | -4.1% | 79.8 | 25.5 | 194 | 118 | 67 | 51 | 100 | 0.62 |
| Memo:UK | -5.4% | -8.5% | 10.7% | 90.6 | 44.2 | 179 | 118 | 69 | 50 | 101 | 0.44 |
| Since 1990 except Services (Oct 1996) 208 - Count | Services: | 126 -Count | |||||||||
| Sentiment is an index, sector readings are net balance diffusion measures | |||||||||||
by Robert Brusca May 29, 2008
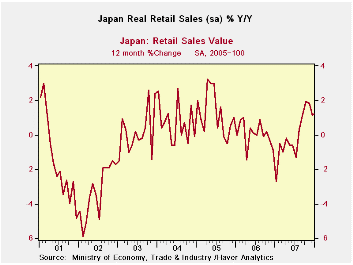
Japan’s retail sales have been floundering and in a downtrend
since 2005. But in December of 2007 and January of 2008 sales suddenly
spiked. They have since settled back down into the sleepy pattern we
have been used to. Indeed, sales are weakening sharply in 2008-Q2 after
a sales surge in 2008-Q1. Sales spiked to a 3.2% annual rate in Q1 on
the back of a 12.7% pace of sales in the auto sector. But in 2008-Q2
sales are starting out quite weak at an annual rate pace of -0.8%. Auto
sales are falling at a -2.7% annual rate. Fabric and apparel retail
sales are off at a 15.6% pace in the new quarter. The sales boom in
Japan appears to have been quite short-lived.
| Japan Retail Sales Trends | ||||||||
|---|---|---|---|---|---|---|---|---|
| Apr-08 | Mar-08 | Feb-08 | 3-mo | 6-mo | 12-mo | Yr-Ago | Q-to-Date | |
| Total SA | -0.1% | 0.4% | -0.9% | -2.4% | -0.8% | 0.4% | -0.8% | -0.8% |
| Not seasonally adjusted | ||||||||
| Total: Nominal | -0.8% | -2.4% | 2.4% | -3.6% | -1.0% | 0.1% | -3.1% | -9.7% |
| Motor Vehicles | 1.6% | -1.4% | -3.2% | -11.5% | -2.0% | 4.1% | -27.8% | -2.7% |
| Food & Beverage | -0.5% | -0.5% | 1.9% | 3.8% | 1.7% | 0.6% | 4.6% | -1.1% |
| Fabric apparel & access | -2.4% | -3.0% | 5.0% | -2.3% | -1.1% | -2.5% | -6.4% | -15.6% |
| Rest of Retail | -1.3% | -3.7% | 3.5% | -6.3% | -2.3% | -0.7% | -0.6% | -14.9% |

Tom Moeller
AuthorMore in Author Profile »Prior to joining Haver Analytics in 2000, Mr. Moeller worked as the Economist at Chancellor Capital Management from 1985 to 1999. There, he developed comprehensive economic forecasts and interpreted economic data for equity and fixed income portfolio managers. Also at Chancellor, Mr. Moeller worked as an equity analyst and was responsible for researching and rating companies in the economically sensitive automobile and housing industries for investment in Chancellor’s equity portfolio. Prior to joining Chancellor, Mr. Moeller was an Economist at Citibank from 1979 to 1984. He also analyzed pricing behavior in the metals industry for the Council on Wage and Price Stability in Washington, D.C. In 1999, Mr. Moeller received the award for most accurate forecast from the Forecasters' Club of New York. From 1990 to 1992 he was President of the New York Association for Business Economists. Mr. Moeller earned an M.B.A. in Finance from Fordham University, where he graduated in 1987. He holds a Bachelor of Arts in Economics from George Washington University.
More Economy in Brief


